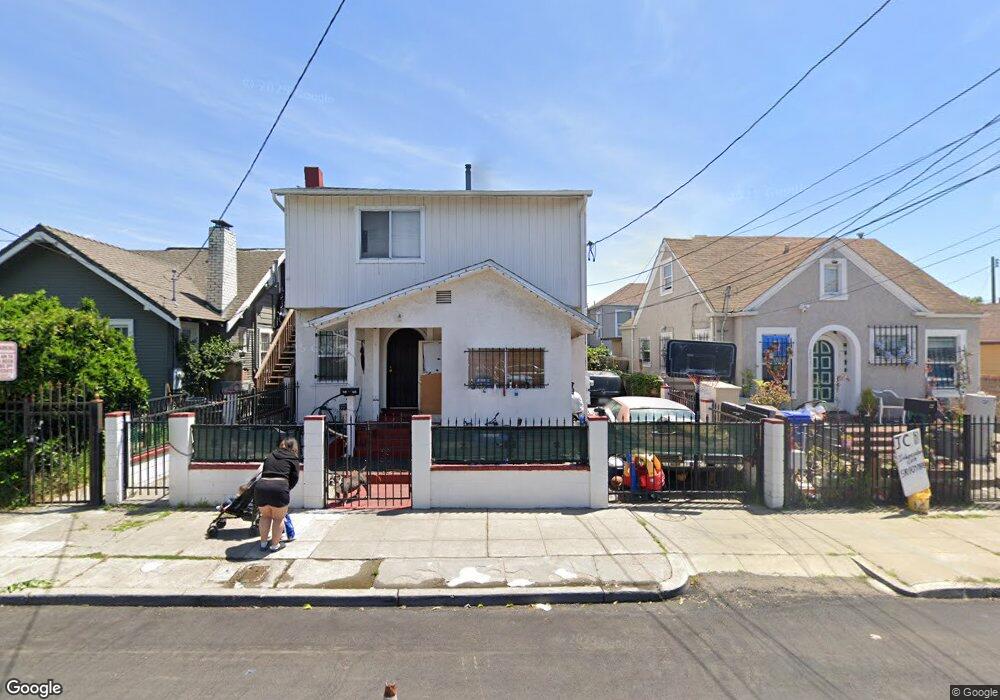
2026 57th Ave Oakland, CA 94621
Seminary NeighborhoodEstimated Value: $442,000 - $458,000
3
Beds
2
Baths
1,564
Sq Ft
$288/Sq Ft
Est. Value
About This Home
This home is located at 2026 57th Ave, Oakland, CA 94621 and is currently estimated at $450,000, approximately $287 per square foot. 2026 57th Ave is a home located in Alameda County with nearby schools including Greenleaf Elementary School, Coliseum College Prep Academy, and Fremont High School.
Ownership History
Date
Name
Owned For
Owner Type
Purchase Details
Closed on
Nov 6, 2024
Sold by
Saeed Mohamed Mohsen
Bought by
Saeed Investments Llc
Current Estimated Value
Purchase Details
Closed on
Oct 12, 2021
Sold by
Gelan Arwa M
Bought by
Mohamed Mohsen Saeed
Home Financials for this Owner
Home Financials are based on the most recent Mortgage that was taken out on this home.
Original Mortgage
$334,200
Interest Rate
2.8%
Mortgage Type
New Conventional
Purchase Details
Closed on
Dec 21, 2012
Sold by
Mohamed Mohsen Saeed
Bought by
Mohamed Mohsen S
Home Financials for this Owner
Home Financials are based on the most recent Mortgage that was taken out on this home.
Original Mortgage
$190,000
Interest Rate
3.35%
Mortgage Type
Credit Line Revolving
Purchase Details
Closed on
May 13, 2009
Sold by
Bank Of New York
Bought by
Mohamed Mohsen Saeed
Purchase Details
Closed on
Apr 23, 2008
Sold by
Neiafu Malia Luisa Ofa Ki
Bought by
Bank Of New York and Cwalt Inc
Purchase Details
Closed on
Oct 19, 2005
Sold by
Neiafu Malia Luisa Ofa Ki and Finau Emma L
Bought by
Neiafu Malia Luisa Ofa Ki
Home Financials for this Owner
Home Financials are based on the most recent Mortgage that was taken out on this home.
Original Mortgage
$477,000
Interest Rate
7.37%
Mortgage Type
Commercial
Purchase Details
Closed on
Feb 2, 2005
Sold by
Saulala Malia and Neiafu Malia Saulala Ofa Ki
Bought by
Neiafu Malia Luisa Ofa Ki and Finau Emma L
Home Financials for this Owner
Home Financials are based on the most recent Mortgage that was taken out on this home.
Original Mortgage
$382,500
Interest Rate
6.8%
Mortgage Type
Commercial
Purchase Details
Closed on
Jan 18, 2005
Sold by
Saulala Malia
Bought by
Saulala Malia and Finau Emma
Home Financials for this Owner
Home Financials are based on the most recent Mortgage that was taken out on this home.
Original Mortgage
$382,500
Interest Rate
6.8%
Mortgage Type
Commercial
Purchase Details
Closed on
Dec 4, 2003
Sold by
Campbell Katherine J
Bought by
Saulala Malia
Home Financials for this Owner
Home Financials are based on the most recent Mortgage that was taken out on this home.
Original Mortgage
$268,000
Interest Rate
6.82%
Mortgage Type
Commercial
Purchase Details
Closed on
Nov 26, 2003
Sold by
Saulala Heamasi L
Bought by
Saulala Malia
Home Financials for this Owner
Home Financials are based on the most recent Mortgage that was taken out on this home.
Original Mortgage
$268,000
Interest Rate
6.82%
Mortgage Type
Commercial
Create a Home Valuation Report for This Property
The Home Valuation Report is an in-depth analysis detailing your home's value as well as a comparison with similar homes in the area
Home Values in the Area
Average Home Value in this Area
Purchase History
| Date | Buyer | Sale Price | Title Company |
|---|---|---|---|
| Saeed Investments Llc | -- | None Listed On Document | |
| Saeed Investments Llc | -- | None Listed On Document | |
| Mohamed Mohsen Saeed | -- | Chicago Title Company | |
| Mohamed Mohsen S | -- | Pacific Coast Title Company | |
| Mohamed Mohsen Saeed | $95,000 | First American Title Company | |
| Bank Of New York | $228,650 | Landsafe Title | |
| Neiafu Malia Luisa Ofa Ki | $239,000 | Commonwealth Title | |
| Neiafu Malia Luisa Ofa Ki | $128,000 | Commonwealth Land Title | |
| Saulala Malia | $318,500 | -- | |
| Saulala Malia | $335,000 | Ticor Title Company Of Calif | |
| Saulala Malia | -- | Ticor Title Company Of Calif |
Source: Public Records
Mortgage History
| Date | Status | Borrower | Loan Amount |
|---|---|---|---|
| Previous Owner | Mohamed Mohsen Saeed | $334,200 | |
| Previous Owner | Mohamed Mohsen S | $190,000 | |
| Previous Owner | Neiafu Malia Luisa Ofa Ki | $477,000 | |
| Previous Owner | Neiafu Malia Luisa Ofa Ki | $382,500 | |
| Previous Owner | Saulala Malia | $268,000 | |
| Closed | Saulala Malia | $50,250 |
Source: Public Records
Tax History
| Year | Tax Paid | Tax Assessment Tax Assessment Total Assessment is a certain percentage of the fair market value that is determined by local assessors to be the total taxable value of land and additions on the property. | Land | Improvement |
|---|---|---|---|---|
| 2025 | $3,876 | $122,328 | $36,698 | $85,630 |
| 2024 | $3,876 | $119,930 | $35,979 | $83,951 |
| 2023 | $3,909 | $117,578 | $35,273 | $82,305 |
| 2022 | $3,664 | $115,274 | $34,582 | $80,692 |
| 2021 | $3,285 | $113,014 | $33,904 | $79,110 |
| 2020 | $3,245 | $111,856 | $33,557 | $78,299 |
| 2019 | $2,985 | $109,663 | $32,899 | $76,764 |
| 2018 | $2,925 | $107,514 | $32,254 | $75,260 |
| 2017 | $2,759 | $105,405 | $31,621 | $73,784 |
| 2016 | $2,585 | $103,340 | $31,002 | $72,338 |
| 2015 | $2,566 | $101,788 | $30,536 | $71,252 |
| 2014 | $2,663 | $99,794 | $29,938 | $69,856 |
Source: Public Records
Map
Nearby Homes
- 5715 E 16th St
- 5955 Hayes St
- 5400 Princeton St
- 5503 Foothill Blvd
- 5609 Foothill Blvd
- 5914 International Blvd
- 5910 International Blvd
- 2451 Seminary Ave
- 1433 56th Ave
- 6241 Bromley Ave
- 5440 Wadean Place
- 5339 Princeton St
- 2254 62nd Ave
- 6230 Hayes St
- 5492 Ruth Ave
- 5406 Trask St
- 5500 Laverne Ave
- 5706 Brookdale Ave
- 1321 60th Ave
- 5428 Ruth Ave
Your Personal Tour Guide
Ask me questions while you tour the home.