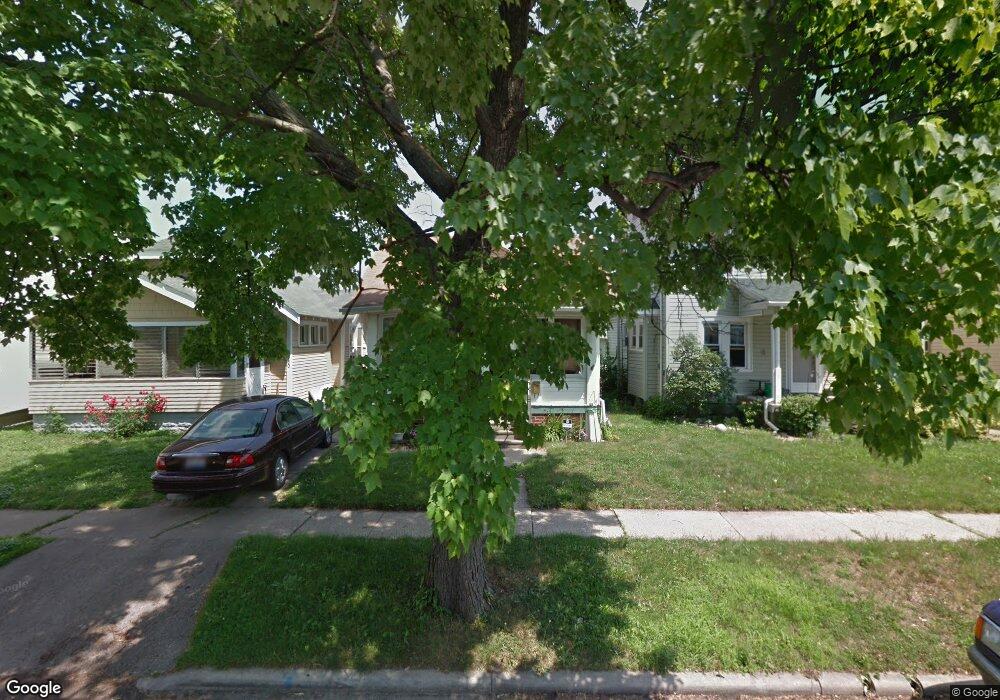
2026 Brame Place Toledo, OH 43613
DeVeaux NeighborhoodEstimated Value: $63,290 - $79,000
3
Beds
1
Bath
746
Sq Ft
$99/Sq Ft
Est. Value
About This Home
This home is located at 2026 Brame Place, Toledo, OH 43613 and is currently estimated at $73,573, approximately $98 per square foot. 2026 Brame Place is a home located in Lucas County with nearby schools including DeVeaux Elementary School, Start High School, and Horizon Science Academy - Toledo High School.
Ownership History
Date
Name
Owned For
Owner Type
Purchase Details
Closed on
Apr 11, 2022
Sold by
Winsper David T
Bought by
Duane B Marshall
Current Estimated Value
Purchase Details
Closed on
Mar 18, 2014
Sold by
Grayhawk Asset Advisors Llc
Bought by
Winsper David T and Marshall Duane B
Purchase Details
Closed on
Jul 29, 2010
Sold by
Ftl Properties Ltd
Bought by
Grayhawk Asset Advisors Llc
Purchase Details
Closed on
Feb 2, 2006
Sold by
Henderson Arvel R and Stephens Kent A
Bought by
Ftl Properties Ltd
Purchase Details
Closed on
May 12, 2000
Sold by
Corporation Tansel Properties Inc A Michigan
Bought by
Henderson Ii Arvel Ray and Henderson Ii Arvel R
Home Financials for this Owner
Home Financials are based on the most recent Mortgage that was taken out on this home.
Original Mortgage
$45,816
Interest Rate
8.26%
Purchase Details
Closed on
Nov 30, 1992
Sold by
Beneteau Jerie
Create a Home Valuation Report for This Property
The Home Valuation Report is an in-depth analysis detailing your home's value as well as a comparison with similar homes in the area
Home Values in the Area
Average Home Value in this Area
Purchase History
| Date | Buyer | Sale Price | Title Company |
|---|---|---|---|
| Duane B Marshall | -- | -- | |
| Winsper David T | $20,000 | Louisville Title Agency | |
| Grayhawk Asset Advisors Llc | $12,500 | Louisville Title Agency For | |
| Ftl Properties Ltd | -- | None Available | |
| Henderson Ii Arvel Ray | $32,500 | Midland | |
| -- | $25,000 | -- |
Source: Public Records
Mortgage History
| Date | Status | Borrower | Loan Amount |
|---|---|---|---|
| Previous Owner | Henderson Ii Arvel Ray | $45,816 |
Source: Public Records
Tax History Compared to Growth
Tax History
| Year | Tax Paid | Tax Assessment Tax Assessment Total Assessment is a certain percentage of the fair market value that is determined by local assessors to be the total taxable value of land and additions on the property. | Land | Improvement |
|---|---|---|---|---|
| 2024 | $17,151 | $14,630 | $5,320 | $9,310 |
| 2023 | $826 | $12,110 | $3,640 | $8,470 |
| 2022 | $829 | $12,110 | $3,640 | $8,470 |
| 2021 | $847 | $12,110 | $3,640 | $8,470 |
| 2020 | $924 | $11,725 | $3,500 | $8,225 |
| 2019 | $897 | $11,725 | $3,500 | $8,225 |
| 2018 | $911 | $11,725 | $3,500 | $8,225 |
| 2017 | $3,278 | $11,480 | $3,430 | $8,050 |
| 2016 | $2,032 | $32,800 | $9,800 | $23,000 |
| 2015 | $920 | $32,800 | $9,800 | $23,000 |
| 2014 | $1,053 | $11,480 | $3,430 | $8,050 |
| 2013 | $742 | $11,480 | $3,430 | $8,050 |
Source: Public Records
Map
Nearby Homes
- 2002 Brame Place
- 2041 Brame Place
- 1959 Brussels St
- 2020 Berkshire Place
- 2026 Berkshire Place
- 1921 Brussels St
- 2035 Barrows St
- 2012 Berdan Ave
- 2050 Berdan Ave
- 1828 Brame Place
- 2227 Castlewood Dr
- 1861 Tremainsville Rd
- 1820 Barrows St
- 1939 Balkan Place
- 1818 Barrows St
- 1834 Berdan Ave
- 3715 Shelbourne Ave
- 1846 Balkan Place
- 4015 Roanoke Rd
- 1935 Talbot St
- 2030 Brame Place
- 2024 Brame Place
- 2020 Brame Place
- 2019 W Sylvania Ave
- 2014 Brame Place
- 2017 W Sylvania Ave
- 2010 Brame Place
- 2027 Brame Place
- 2023 Brame Place
- 2015 W Sylvania Ave
- 2021 Brame Place
- 2008 Brame Place
- 2017 Brame Place
- 2009 W Sylvania Ave
- 2035 Brame Place
- 2015 Brame Place
- 2004 Brame Place
- 2011 Brame Place
- 2032 Brussels St
- 2005 Brame Place