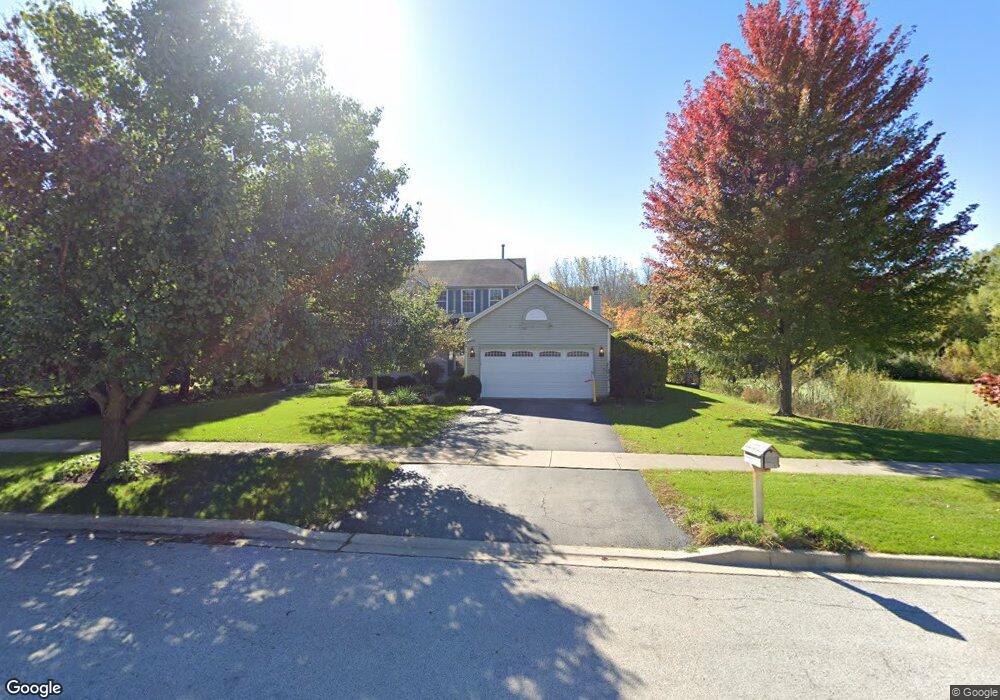
2026 Corinne Rd Aurora, IL 60506
Blackberry Countryside NeighborhoodEstimated Value: $381,000 - $435,958
3
Beds
4
Baths
1,996
Sq Ft
$208/Sq Ft
Est. Value
About This Home
This home is located at 2026 Corinne Rd, Aurora, IL 60506 and is currently estimated at $414,740, approximately $207 per square foot. 2026 Corinne Rd is a home located in Kane County with nearby schools including Freeman Elementary School, Washington Middle School, and West Aurora High School.
Ownership History
Date
Name
Owned For
Owner Type
Purchase Details
Closed on
Sep 3, 2009
Sold by
Leonardi Anthony and Leonardi Ellen E
Bought by
Ream Joshua P and Ream Jana L
Current Estimated Value
Home Financials for this Owner
Home Financials are based on the most recent Mortgage that was taken out on this home.
Original Mortgage
$239,239
Outstanding Balance
$155,419
Interest Rate
5.38%
Mortgage Type
FHA
Estimated Equity
$259,321
Purchase Details
Closed on
Apr 28, 2000
Sold by
Neumann Homes Inc
Bought by
Leonardi Anthony and Leonardi Ellen E
Home Financials for this Owner
Home Financials are based on the most recent Mortgage that was taken out on this home.
Original Mortgage
$165,000
Interest Rate
8.24%
Purchase Details
Closed on
Dec 17, 1999
Sold by
Victor Avram Contractor Inc
Bought by
Neumann Homes Inc
Create a Home Valuation Report for This Property
The Home Valuation Report is an in-depth analysis detailing your home's value as well as a comparison with similar homes in the area
Home Values in the Area
Average Home Value in this Area
Purchase History
| Date | Buyer | Sale Price | Title Company |
|---|---|---|---|
| Ream Joshua P | $247,500 | Multiple | |
| Leonardi Anthony | $190,000 | Chicago Title Insurance Co | |
| Neumann Homes Inc | $94,000 | Chicago Title Insurance Co |
Source: Public Records
Mortgage History
| Date | Status | Borrower | Loan Amount |
|---|---|---|---|
| Open | Ream Joshua P | $239,239 | |
| Previous Owner | Leonardi Anthony | $165,000 |
Source: Public Records
Tax History
| Year | Tax Paid | Tax Assessment Tax Assessment Total Assessment is a certain percentage of the fair market value that is determined by local assessors to be the total taxable value of land and additions on the property. | Land | Improvement |
|---|---|---|---|---|
| 2024 | $9,061 | $122,441 | $20,956 | $101,485 |
| 2023 | $8,685 | $109,400 | $18,724 | $90,676 |
| 2022 | $8,305 | $99,818 | $17,084 | $82,734 |
| 2021 | $7,942 | $92,931 | $15,905 | $77,026 |
| 2020 | $8,637 | $98,255 | $14,773 | $83,482 |
| 2019 | $8,315 | $91,036 | $13,688 | $77,348 |
| 2018 | $8,417 | $90,310 | $12,661 | $77,649 |
| 2017 | $8,958 | $93,045 | $11,666 | $81,379 |
| 2016 | $8,441 | $85,454 | $12,654 | $72,800 |
| 2015 | -- | $87,392 | $10,881 | $76,511 |
| 2014 | -- | $82,062 | $10,465 | $71,597 |
| 2013 | -- | $80,378 | $9,800 | $70,578 |
Source: Public Records
Map
Nearby Homes
- Napa Plan at Prairie Meadows
- Siena Plan at Prairie Meadows
- Sonoma Plan at Prairie Meadows
- Rutherford Plan at Prairie Meadows
- 375 S Constitution Dr
- 378 Cottrell Ln
- 381 S Constitution Dr
- 387 S Constitution Dr
- 393 S Constitution Dr
- 417 S Constitution Dr
- 396 Cottrell Ln
- 170 Alschuler Dr
- 413 Cottrell Ln
- 417 Cottrell Ln
- 433 Cottrell Ln
- 425 Cottrell Ln
- 113 S Westlawn Ave
- 1730 W Galena Blvd Unit 402E
- 1751 Greene Ct
- 2265 Fitchome St
- 2021 Kensington Place
- 2011 Kensington Place
- 285 N Kingsway Dr
- 2001 Kensington Place
- 2025 Corinne Rd
- 295 N Kingsway Dr
- 265 N Kingsway Dr
- 2065 Corinne Rd
- 2076 Corinne Rd
- 2075 Corinne Rd
- 2020 Carolyn Rd
- 2024 Kensington Place
- 255 N Kingsway Dr
- 2014 Kensington Place
- 280 N Kingsway Dr
- 270 N Kingsway Dr
- 2004 Kensington Place
- 290 N Kingsway Dr
- 315 N Kingsway Dr
- 2085 Corinne Rd
Your Personal Tour Guide
Ask me questions while you tour the home.