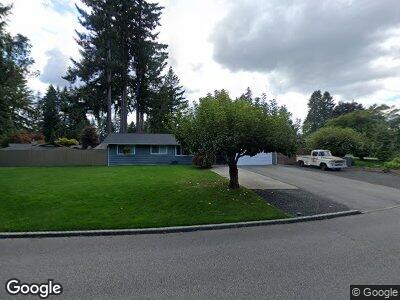
2026 Ponderosa Dr SE Port Orchard, WA 98366
Parkwood NeighborhoodEstimated Value: $441,750 - $473,000
3
Beds
2
Baths
1,228
Sq Ft
$377/Sq Ft
Est. Value
About This Home
This home is located at 2026 Ponderosa Dr SE, Port Orchard, WA 98366 and is currently estimated at $463,188, approximately $377 per square foot. 2026 Ponderosa Dr SE is a home located in Kitsap County with nearby schools including Orchard Heights Elementary School, Marcus Whitman Middle School, and South Kitsap High School.
Ownership History
Date
Name
Owned For
Owner Type
Purchase Details
Closed on
Nov 3, 2017
Sold by
Middendorf Eric E
Bought by
Phillips Christopher A and Phillips Sharon M
Current Estimated Value
Home Financials for this Owner
Home Financials are based on the most recent Mortgage that was taken out on this home.
Original Mortgage
$265,000
Interest Rate
3.83%
Mortgage Type
New Conventional
Purchase Details
Closed on
Nov 6, 2009
Sold by
Caldwell Jesse C and Caldwell Sunye
Bought by
Middendorf Eric E and Middendorf Amy L
Home Financials for this Owner
Home Financials are based on the most recent Mortgage that was taken out on this home.
Original Mortgage
$188,520
Interest Rate
4.99%
Mortgage Type
New Conventional
Purchase Details
Closed on
Oct 20, 1999
Sold by
Scifers Leonard H and Scifers Karen S
Bought by
Caldwell Jesse C and Caldwell Sunye
Home Financials for this Owner
Home Financials are based on the most recent Mortgage that was taken out on this home.
Original Mortgage
$87,150
Interest Rate
9.84%
Create a Home Valuation Report for This Property
The Home Valuation Report is an in-depth analysis detailing your home's value as well as a comparison with similar homes in the area
Home Values in the Area
Average Home Value in this Area
Purchase History
| Date | Buyer | Sale Price | Title Company |
|---|---|---|---|
| Phillips Christopher A | -- | Attorney Title | |
| Middendorf Eric E | $185,030 | Pacific Nw Title | |
| Caldwell Jesse C | $124,500 | Transnation Title Insurance |
Source: Public Records
Mortgage History
| Date | Status | Borrower | Loan Amount |
|---|---|---|---|
| Open | Phillips Christopher A | $276,000 | |
| Closed | Phillips Christopher A | $265,000 | |
| Previous Owner | Middendorf Eric E | $188,520 | |
| Previous Owner | Caldwell Jesse C | $87,150 |
Source: Public Records
Tax History Compared to Growth
Tax History
| Year | Tax Paid | Tax Assessment Tax Assessment Total Assessment is a certain percentage of the fair market value that is determined by local assessors to be the total taxable value of land and additions on the property. | Land | Improvement |
|---|---|---|---|---|
| 2025 | $3,367 | $380,440 | $67,110 | $313,330 |
| 2024 | $3,265 | $380,440 | $67,110 | $313,330 |
| 2023 | $3,243 | $380,440 | $67,110 | $313,330 |
| 2022 | $3,190 | $313,620 | $62,670 | $250,950 |
| 2021 | $2,934 | $272,570 | $58,230 | $214,340 |
| 2020 | $2,883 | $260,310 | $55,460 | $204,850 |
| 2019 | $2,379 | $234,790 | $54,490 | $180,300 |
| 2018 | $2,382 | $183,220 | $54,490 | $128,730 |
| 2017 | $2,050 | $183,220 | $54,490 | $128,730 |
| 2016 | $2,014 | $164,800 | $54,490 | $110,310 |
| 2015 | $1,952 | $161,890 | $54,490 | $107,400 |
| 2014 | -- | $158,990 | $54,490 | $104,500 |
| 2013 | -- | $157,390 | $57,360 | $100,030 |
Source: Public Records
Map
Nearby Homes
- 2240 Ponderosa Dr SE
- 1359 Marlin Dr SE
- 1330 Marlin Dr SE
- 1560 Woodridge Dr SE
- 3930 SE Mile Hill Dr
- 3900 SE Mile Hill Dr
- 1978 Kelowna Place Southest
- 3299 Madrona Dr SE
- 691 SE Olga Cir
- 1350 Holmes Ave SE
- 2541 Red Spruce Dr SE
- 2457 White Cedar Dr SE
- 3799 SE Horstman Rd
- 2893 Maple Crest Ln SE
- 884 Cherub Place E
- 2453 Parkwood Dr SE
- 1000 Hillandale Dr E
- 2987 Long Lake Rd SE
- 5263 SE Morning Mist Rd
- 2523 Jackson Ave SE
- 2026 Ponderosa Dr SE
- 2034 Ponderosa Dr SE
- 2018 Ponderosa Dr SE
- 2058 SE Beech Ct
- 2037 Ponderosa Dr SE
- 2021 Ponderosa Dr SE
- 2033 Ponderosa Dr SE
- 2025 Ponderosa Dr SE
- 2041 Ponderosa Dr SE
- 2010 Ponderosa Dr SE
- 2017 Ponderosa Dr SE
- 2054 SE Beech Ct
- 2029 Ponderosa Dr SE
- 2045 Ponderosa Dr SE
- 2013 Ponderosa Dr SE
- 2066 SE Beech Ct
- 2002 Ponderosa Dr SE
- 2049 Ponderosa Dr SE
- 2005 Ponderosa Dr SE
- 2072 SE Beech Ct