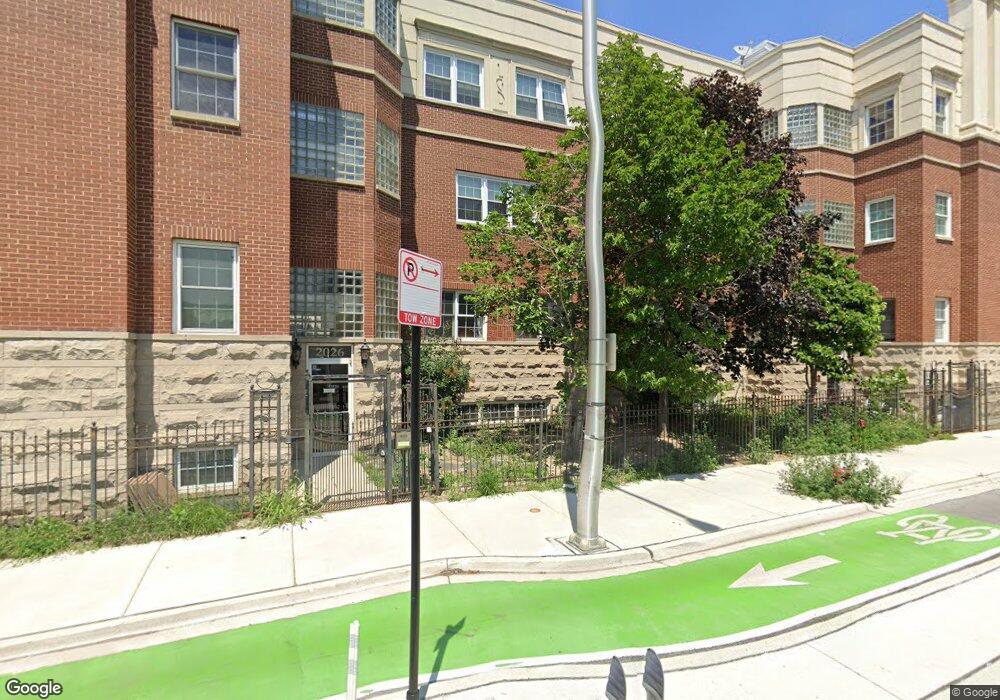
2026 W Grand Ave Unit 2026D Chicago, IL 60612
West Town NeighborhoodEstimated Value: $471,000 - $753,000
3
Beds
2
Baths
22,800
Sq Ft
$25/Sq Ft
Est. Value
About This Home
This home is located at 2026 W Grand Ave Unit 2026D, Chicago, IL 60612 and is currently estimated at $578,148, approximately $25 per square foot. 2026 W Grand Ave Unit 2026D is a home located in Cook County with nearby schools including Talcott Elementary School, Wells Community Academy High School, and St Nicholas Cathedral.
Ownership History
Date
Name
Owned For
Owner Type
Purchase Details
Closed on
Oct 7, 2016
Sold by
Plunkett Christopher B and Plunkett Marilyn C
Bought by
Wu Zhi and Evoghli Soheil
Current Estimated Value
Home Financials for this Owner
Home Financials are based on the most recent Mortgage that was taken out on this home.
Original Mortgage
$397,600
Outstanding Balance
$319,155
Interest Rate
3.5%
Mortgage Type
New Conventional
Estimated Equity
$258,993
Purchase Details
Closed on
Sep 27, 2002
Sold by
Chicago Title Land Trust Company
Bought by
Plunkett Christopher B and Plunkett Marilyn C
Home Financials for this Owner
Home Financials are based on the most recent Mortgage that was taken out on this home.
Original Mortgage
$300,700
Interest Rate
6.24%
Mortgage Type
Balloon
Create a Home Valuation Report for This Property
The Home Valuation Report is an in-depth analysis detailing your home's value as well as a comparison with similar homes in the area
Home Values in the Area
Average Home Value in this Area
Purchase History
| Date | Buyer | Sale Price | Title Company |
|---|---|---|---|
| Wu Zhi | $497,000 | None Available | |
| Plunkett Christopher B | $390,000 | -- |
Source: Public Records
Mortgage History
| Date | Status | Borrower | Loan Amount |
|---|---|---|---|
| Open | Wu Zhi | $397,600 | |
| Previous Owner | Plunkett Christopher B | $300,700 |
Source: Public Records
Tax History Compared to Growth
Tax History
| Year | Tax Paid | Tax Assessment Tax Assessment Total Assessment is a certain percentage of the fair market value that is determined by local assessors to be the total taxable value of land and additions on the property. | Land | Improvement |
|---|---|---|---|---|
| 2024 | $8,916 | $46,229 | $8,222 | $38,007 |
| 2023 | $8,665 | $42,130 | $3,752 | $38,378 |
| 2022 | $8,665 | $42,130 | $3,752 | $38,378 |
| 2021 | $8,472 | $42,129 | $3,752 | $38,377 |
| 2020 | $7,903 | $35,476 | $3,752 | $31,724 |
| 2019 | $8,211 | $40,869 | $3,752 | $37,117 |
| 2018 | $8,073 | $40,869 | $3,752 | $37,117 |
| 2017 | $6,933 | $32,206 | $3,310 | $28,896 |
| 2016 | $5,950 | $32,206 | $3,310 | $28,896 |
| 2015 | $5,421 | $32,206 | $3,310 | $28,896 |
| 2014 | $5,086 | $29,979 | $2,814 | $27,165 |
| 2013 | $4,974 | $29,979 | $2,814 | $27,165 |
Source: Public Records
Map
Nearby Homes
- 2035 W Race Ave
- 2049 W Race Ave
- 2055 W Race Ave
- 2059 W Race Ave
- 2002 W Ohio St
- 1934 W Race Ave
- 2035 W Erie St
- 2059 W Erie St
- 2036 W Erie St
- 2005 W Huron St Unit 1
- 2106 W Erie St Unit 1E
- 2138 W Ohio St Unit 3
- 518 N Leavitt St Unit 3
- 512 N Leavitt St
- 2127 W Huron St
- 1812 - 1814 W Grand Ave
- 530 N Wood St Unit D
- 2149 W Huron St
- 2209 W Erie St
- 1819 W Erie St
- 2026 W Grand Ave Unit 2026C
- 2026 W Grand Ave Unit 2026F
- 2026 W Grand Ave Unit 2026B
- 2026 W Grand Ave Unit 2026E
- 2026 W Grand Ave Unit 2026A
- 2026 W Grand Ave Unit F
- 2026 W Grand Ave Unit C
- 2026 W Grand Ave Unit D
- 2026 W Grand Ave Unit E
- 2026 W Grand Ave Unit B
- 2020 W Grand Ave Unit 2020A
- 2020 W Grand Ave Unit 2020D
- 2020 W Grand Ave Unit 2020E
- 2020 W Grand Ave Unit 2020C
- 2020 W Grand Ave Unit 2020B
- 2020 W Grand Ave Unit 2020F
- 2020 W Grand Ave Unit C
- 2020 W Grand Ave Unit A
- 2020 W Grand Ave Unit D
- 2020 W Grand Ave Unit F