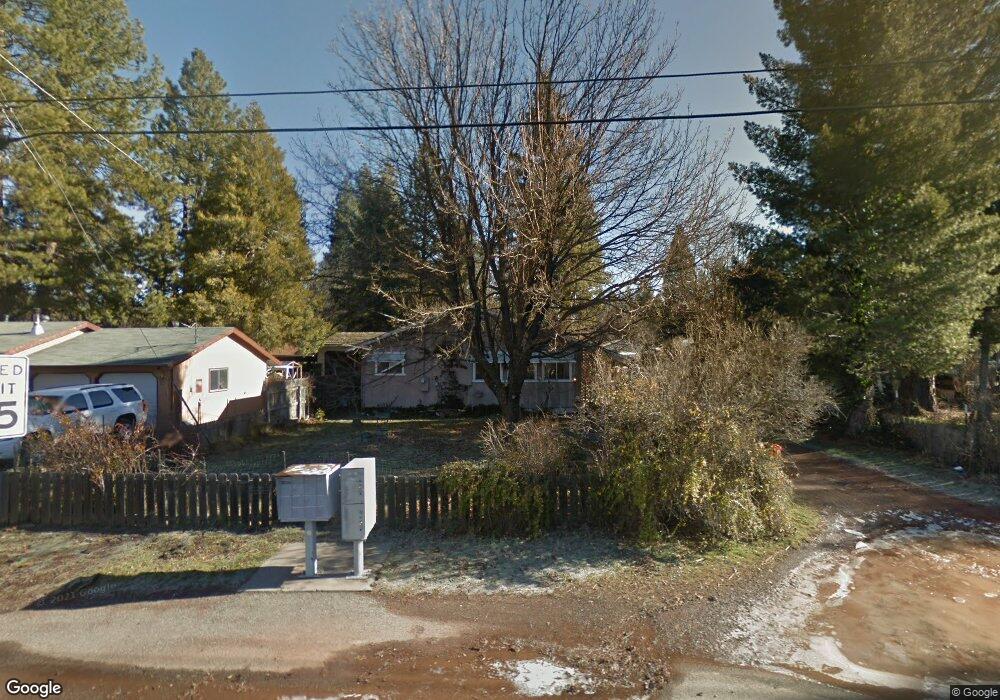
20267 Grogan St Burney, CA 96013
Estimated Value: $171,548 - $239,000
3
Beds
2
Baths
1,551
Sq Ft
$131/Sq Ft
Est. Value
About This Home
This home is located at 20267 Grogan St, Burney, CA 96013 and is currently estimated at $203,387, approximately $131 per square foot. 20267 Grogan St is a home located in Shasta County with nearby schools including Burney Elementary School and Burney Junior/Senior High School.
Ownership History
Date
Name
Owned For
Owner Type
Purchase Details
Closed on
Dec 14, 2011
Sold by
Casaurang James E
Bought by
Casaurang James E and Casaurang Karen
Current Estimated Value
Purchase Details
Closed on
Aug 11, 2008
Sold by
Casaurang Gwen A
Bought by
Casaurang Gwen
Create a Home Valuation Report for This Property
The Home Valuation Report is an in-depth analysis detailing your home's value as well as a comparison with similar homes in the area
Home Values in the Area
Average Home Value in this Area
Purchase History
| Date | Buyer | Sale Price | Title Company |
|---|---|---|---|
| Casaurang James E | -- | None Available | |
| Casaurang Gwen | -- | None Available |
Source: Public Records
Tax History
| Year | Tax Paid | Tax Assessment Tax Assessment Total Assessment is a certain percentage of the fair market value that is determined by local assessors to be the total taxable value of land and additions on the property. | Land | Improvement |
|---|---|---|---|---|
| 2025 | $483 | $45,671 | $13,078 | $32,593 |
| 2024 | $476 | $44,776 | $12,822 | $31,954 |
| 2023 | $476 | $43,899 | $12,571 | $31,328 |
| 2022 | $463 | $43,039 | $12,325 | $30,714 |
| 2021 | $452 | $42,196 | $12,084 | $30,112 |
| 2020 | $451 | $41,765 | $11,961 | $29,804 |
| 2019 | $433 | $40,947 | $11,727 | $29,220 |
| 2018 | $451 | $40,146 | $11,498 | $28,648 |
| 2017 | $428 | $39,360 | $11,273 | $28,087 |
| 2016 | $415 | $38,589 | $11,052 | $27,537 |
| 2015 | $407 | $38,010 | $10,886 | $27,124 |
| 2014 | $402 | $37,266 | $10,673 | $26,593 |
Source: Public Records
Map
Nearby Homes
- 37269 Birch Ave
- 20344 Hudson St
- 37217 Park Ave
- 37176 Washburn Ave
- 37329 Ponderosa Ave
- 37353 & 57 Ponderosa Ave
- 37347 Cypress Ave
- 20194 Sugar Pine St
- 20274 Arrowood St
- 37176 Superior Ave Unit A&B
- 20305 Arrowood St
- 0 Serpentine Ln
- 010 Kirby Ct
- 007 Kirby Ct
- 011 Kirby Ct
- 20476 Marquette St
- 37061 Park Ave
- 20365 Arrowood St
- 0 Superior Ave
- 20174 Mapleleaf St
- 20275 Grogan St
- 1484 Grogan St
- 20254 Hudson St
- 20258 Hudson St
- 20262 Hudson St
- 20283 Grogan St
- 20246 Hudson St
- 20276 Hudson St Unit 2
- 20274 Grogan St
- 20268 Grogan St
- 20289 Grogan St
- 20280 Hudson St
- 20286 Grogan St
- 20259 Hudson St
- 20255 Hudson St
- 37200 Washburn Ave Unit 37210
- 37200 Washburn Ave
- 20297 Grogan St
- 20247 Hudson St
- 20294 Grogan St
Your Personal Tour Guide
Ask me questions while you tour the home.