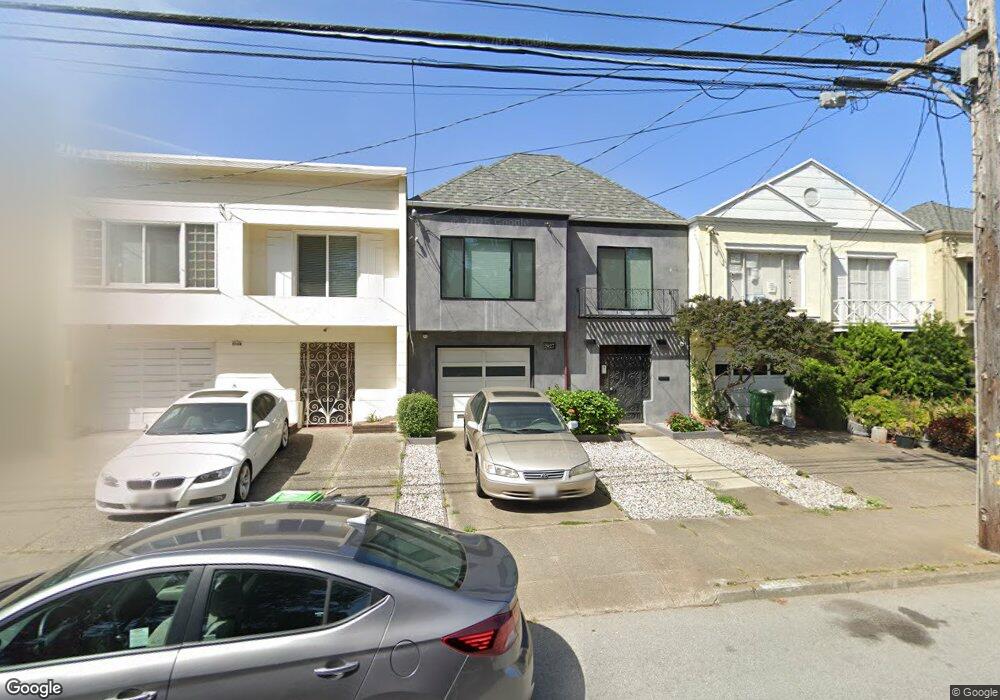
2027 28th Ave San Francisco, CA 94116
Parkside NeighborhoodEstimated Value: $1,554,000 - $1,770,000
3
Beds
2
Baths
1,679
Sq Ft
$982/Sq Ft
Est. Value
About This Home
This home is located at 2027 28th Ave, San Francisco, CA 94116 and is currently estimated at $1,648,811, approximately $982 per square foot. 2027 28th Ave is a home located in San Francisco County with nearby schools including Stevenson (Robert Louis) Elementary School, Giannini (A.P.) Middle School, and Cornerstone Academy-Lawton Campus.
Ownership History
Date
Name
Owned For
Owner Type
Purchase Details
Closed on
Jun 21, 2024
Sold by
Nancy Tay Survivors Trust and Tay Nancy H
Bought by
David And Nancy Tay Revocable Trust and Tay
Current Estimated Value
Home Financials for this Owner
Home Financials are based on the most recent Mortgage that was taken out on this home.
Original Mortgage
$2,850,000
Outstanding Balance
$2,848,163
Interest Rate
6.94%
Mortgage Type
Reverse Mortgage Home Equity Conversion Mortgage
Estimated Equity
-$1,199,352
Purchase Details
Closed on
Feb 1, 2014
Sold by
Maa Raymond Yip
Bought by
Maa Raymond Yip and Raymond Yip Maa Trust
Purchase Details
Closed on
Jan 18, 2014
Sold by
Maa Wilson Yip
Bought by
Maa Wilson Yip and Maa Family Trust
Purchase Details
Closed on
Feb 12, 2011
Sold by
Tay Nancy H and David & Nancy Tay Revocable Tr
Bought by
Tay Nancy H and Nancy Tay Survivors Trust
Purchase Details
Closed on
Aug 30, 2007
Sold by
Tay David T L and Tay Nancy N M
Bought by
Tay David T and Tay Nancy H
Create a Home Valuation Report for This Property
The Home Valuation Report is an in-depth analysis detailing your home's value as well as a comparison with similar homes in the area
Home Values in the Area
Average Home Value in this Area
Purchase History
| Date | Buyer | Sale Price | Title Company |
|---|---|---|---|
| David And Nancy Tay Revocable Trust | -- | Fnc Title | |
| Maa Raymond Yip | -- | None Available | |
| Yee Lucille | -- | None Available | |
| Maa Wilson Yip | -- | None Available | |
| Tay Nancy H | -- | None Available | |
| Tay David T | -- | None Available |
Source: Public Records
Mortgage History
| Date | Status | Borrower | Loan Amount |
|---|---|---|---|
| Open | David And Nancy Tay Revocable Trust | $2,850,000 |
Source: Public Records
Tax History Compared to Growth
Tax History
| Year | Tax Paid | Tax Assessment Tax Assessment Total Assessment is a certain percentage of the fair market value that is determined by local assessors to be the total taxable value of land and additions on the property. | Land | Improvement |
|---|---|---|---|---|
| 2025 | $3,629 | $313,422 | $63,507 | $249,915 |
| 2024 | $3,629 | $307,277 | $62,262 | $245,015 |
| 2023 | $3,576 | $301,253 | $61,042 | $240,211 |
| 2022 | $3,513 | $295,348 | $59,846 | $235,502 |
| 2021 | $3,452 | $289,558 | $58,673 | $230,885 |
| 2020 | $3,462 | $286,590 | $58,072 | $228,518 |
| 2019 | $3,344 | $280,972 | $56,934 | $224,038 |
| 2018 | $3,233 | $275,464 | $55,818 | $219,646 |
| 2017 | $1,779 | $149,262 | $54,724 | $94,538 |
| 2016 | $1,722 | $146,336 | $53,651 | $92,685 |
| 2015 | $1,701 | $144,139 | $52,846 | $91,293 |
| 2014 | $1,656 | $141,316 | $51,811 | $89,505 |
Source: Public Records
Map
Nearby Homes