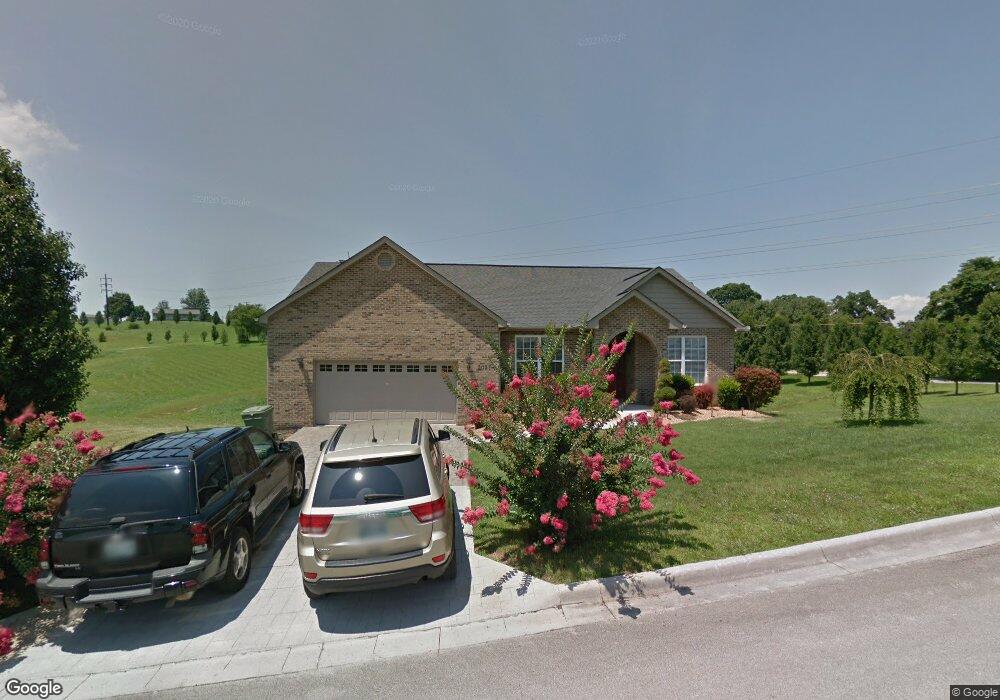
2027 Brights View Ln Morristown, TN 37814
Estimated Value: $268,000 - $377,000
--
Bed
3
Baths
1,667
Sq Ft
$188/Sq Ft
Est. Value
About This Home
This home is located at 2027 Brights View Ln, Morristown, TN 37814 and is currently estimated at $314,037, approximately $188 per square foot. 2027 Brights View Ln is a home located in Hamblen County with nearby schools including Fairview-Marguerite Elementary School, Meadowview Middle School, and Morristown East High School.
Ownership History
Date
Name
Owned For
Owner Type
Purchase Details
Closed on
May 18, 2010
Sold by
Quillen David
Bought by
Acuff Johnny C
Current Estimated Value
Purchase Details
Closed on
Oct 4, 2006
Sold by
M & R Investments Inc
Bought by
Maximino Garcia
Purchase Details
Closed on
Sep 13, 2005
Bought by
M & R Investments Inc
Home Financials for this Owner
Home Financials are based on the most recent Mortgage that was taken out on this home.
Original Mortgage
$134,000
Interest Rate
5.77%
Purchase Details
Closed on
Aug 15, 2003
Bought by
Garcia Maximino
Purchase Details
Closed on
Sep 19, 2002
Bought by
First Claiborne Bank N/K/A First Century Bank
Purchase Details
Closed on
May 11, 1984
Bought by
Greene Arles B and Greene Shannon W
Create a Home Valuation Report for This Property
The Home Valuation Report is an in-depth analysis detailing your home's value as well as a comparison with similar homes in the area
Home Values in the Area
Average Home Value in this Area
Purchase History
| Date | Buyer | Sale Price | Title Company |
|---|---|---|---|
| Acuff Johnny C | $183,000 | -- | |
| Maximino Garcia | -- | -- | |
| M & R Investments Inc | -- | -- | |
| Garcia Maximino | $480,000 | -- | |
| First Claiborne Bank N/K/A First Century Bank | $200,000 | -- | |
| Greene Arles B | -- | -- |
Source: Public Records
Mortgage History
| Date | Status | Borrower | Loan Amount |
|---|---|---|---|
| Previous Owner | Greene Arles B | $134,000 |
Source: Public Records
Tax History Compared to Growth
Tax History
| Year | Tax Paid | Tax Assessment Tax Assessment Total Assessment is a certain percentage of the fair market value that is determined by local assessors to be the total taxable value of land and additions on the property. | Land | Improvement |
|---|---|---|---|---|
| 2024 | $890 | $50,575 | $6,375 | $44,200 |
| 2023 | $890 | $50,575 | $0 | $0 |
| 2022 | $1,598 | $50,575 | $6,375 | $44,200 |
| 2021 | $1,598 | $50,575 | $6,375 | $44,200 |
| 2020 | $1,596 | $50,575 | $6,375 | $44,200 |
| 2019 | $1,566 | $46,075 | $6,100 | $39,975 |
| 2018 | $1,451 | $46,075 | $6,100 | $39,975 |
| 2017 | $1,428 | $46,075 | $6,100 | $39,975 |
| 2016 | $1,364 | $46,075 | $6,100 | $39,975 |
| 2015 | $1,269 | $46,075 | $6,100 | $39,975 |
| 2014 | -- | $46,075 | $6,100 | $39,975 |
| 2013 | -- | $51,775 | $0 | $0 |
Source: Public Records
Map
Nearby Homes
- 1961 Brights View Ln
- 1683 Pebblestone Ct
- 1864 Limestone Path
- 2993 Nicole Cir
- 00 N Davy Crockett Pkwy
- Lot 1 N Davy Crockett Pkwy
- 2165 Brights Pike
- 0 Brights Pike
- 2035 Reese St
- 2031 Brights Pike
- 2909 Nicole Cir
- 2828 Reeds Chapel Rd
- 2657 Lakemoore Dr
- 1250 N Liberty Hill Dr
- 2998 Nicole Cir
- 3004 Nicole Cir
- TBD Clancy Ave
- 1250 N Liberty Hill Rd
- Lot 2 Morelock Rd
- 2552 Lakeview Dr
- 2021 Brights View Ln
- 2497 Howerton Dr
- 2030 Brights View Ln
- 2552 Howerton Dr
- 2552 Howerton Dr
- 2024 Brights View Ln
- 2545 Howerton Dr
- 2535 Howerton Dr
- 2560 Howerton Dr
- 2009 Brights View Ln
- 2566 Howerton Dr
- 2012 Brights View Ln
- 2003 Brights View Ln
- 2555 Howerton Dr
- 2620 Howerton Dr
- 2006 Brights View Ln
- 1967 Brights View Ln
- 2573 Howerton Dr
- 2232 Brights Pike
- 2400 Brights Pike