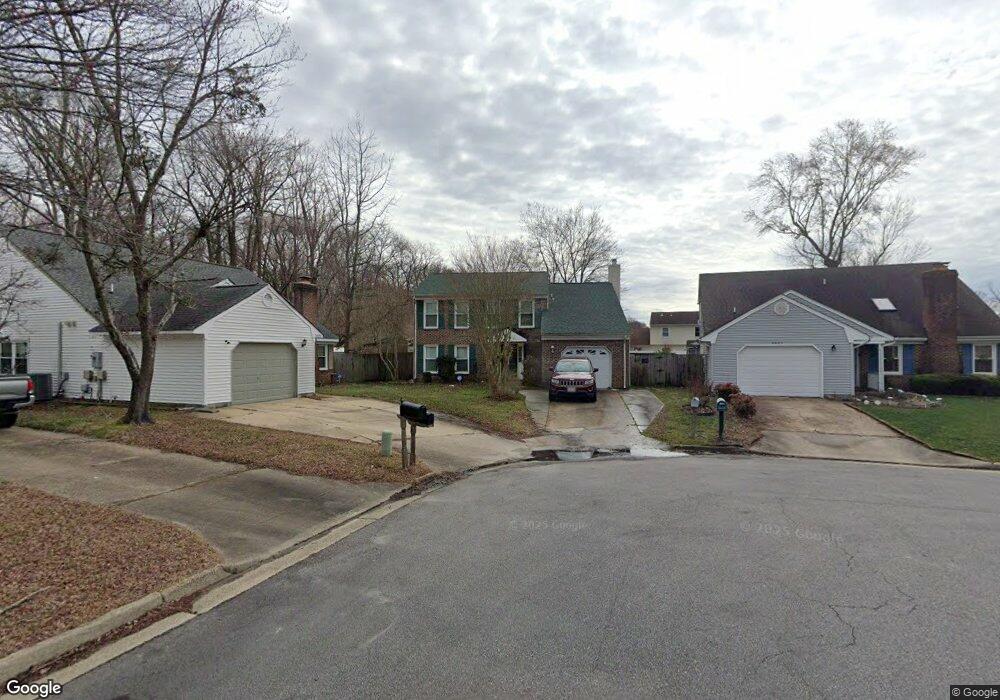
2027 Dawnee Brook Trail N Chesapeake, VA 23320
Greenbrier East NeighborhoodEstimated Value: $406,000 - $431,113
4
Beds
3
Baths
1,937
Sq Ft
$218/Sq Ft
Est. Value
About This Home
This home is located at 2027 Dawnee Brook Trail N, Chesapeake, VA 23320 and is currently estimated at $421,528, approximately $217 per square foot. 2027 Dawnee Brook Trail N is a home located in Chesapeake City with nearby schools including Greenbrier Primary School, Greenbrier Intermediate School, and Greenbrier Middle.
Ownership History
Date
Name
Owned For
Owner Type
Purchase Details
Closed on
Dec 5, 2023
Sold by
Cox Amy E
Bought by
Williams Jamel Anthony and Williams Chinaka Ilene
Current Estimated Value
Home Financials for this Owner
Home Financials are based on the most recent Mortgage that was taken out on this home.
Original Mortgage
$365,000
Outstanding Balance
$359,237
Interest Rate
7.76%
Mortgage Type
VA
Estimated Equity
$62,291
Purchase Details
Closed on
Jun 23, 2011
Sold by
Holyfield Joseph K
Bought by
Cox Amy E
Home Financials for this Owner
Home Financials are based on the most recent Mortgage that was taken out on this home.
Original Mortgage
$191,900
Interest Rate
4.37%
Mortgage Type
FHA
Purchase Details
Closed on
Jun 15, 2007
Sold by
Rivera Joselito
Bought by
Holyfield Joseph L
Home Financials for this Owner
Home Financials are based on the most recent Mortgage that was taken out on this home.
Original Mortgage
$270,697
Interest Rate
6.14%
Mortgage Type
VA
Purchase Details
Closed on
Oct 24, 2003
Sold by
Antonick Todd C
Bought by
Rivera Joselito
Home Financials for this Owner
Home Financials are based on the most recent Mortgage that was taken out on this home.
Original Mortgage
$174,377
Interest Rate
5.62%
Mortgage Type
FHA
Create a Home Valuation Report for This Property
The Home Valuation Report is an in-depth analysis detailing your home's value as well as a comparison with similar homes in the area
Home Values in the Area
Average Home Value in this Area
Purchase History
| Date | Buyer | Sale Price | Title Company |
|---|---|---|---|
| Williams Jamel Anthony | $365,000 | Old Republic National Title | |
| Cox Amy E | $200,000 | -- | |
| Holyfield Joseph L | $265,000 | -- | |
| Rivera Joselito | $176,000 | -- |
Source: Public Records
Mortgage History
| Date | Status | Borrower | Loan Amount |
|---|---|---|---|
| Open | Williams Jamel Anthony | $365,000 | |
| Previous Owner | Cox Amy E | $191,900 | |
| Previous Owner | Holyfield Joseph L | $270,697 | |
| Previous Owner | Rivera Joselito | $174,377 |
Source: Public Records
Tax History Compared to Growth
Tax History
| Year | Tax Paid | Tax Assessment Tax Assessment Total Assessment is a certain percentage of the fair market value that is determined by local assessors to be the total taxable value of land and additions on the property. | Land | Improvement |
|---|---|---|---|---|
| 2025 | $3,832 | $412,100 | $160,000 | $252,100 |
| 2024 | $3,832 | $379,400 | $145,000 | $234,400 |
| 2023 | $3,349 | $361,800 | $125,000 | $236,800 |
| 2022 | $3,316 | $328,300 | $110,000 | $218,300 |
| 2021 | $3,110 | $296,200 | $95,000 | $201,200 |
| 2020 | $2,979 | $283,700 | $90,000 | $193,700 |
| 2019 | $2,898 | $276,000 | $90,000 | $186,000 |
| 2018 | $2,830 | $235,600 | $85,000 | $150,600 |
| 2017 | $2,690 | $256,200 | $90,000 | $166,200 |
| 2016 | $2,569 | $244,700 | $90,000 | $154,700 |
| 2015 | $2,526 | $240,600 | $90,000 | $150,600 |
| 2014 | $2,474 | $235,600 | $85,000 | $150,600 |
Source: Public Records
Map
Nearby Homes
- 1701 Rock Bridge Mews Unit B
- 1980 Woodgate Arch
- 1721 Rock Bridge Mews Unit A
- 1716 Rock Bridge Mews Unit D
- 2120 Rocky Point Run Unit B
- 2115 Rocky Point Run Unit A
- 1916 Woodgate Arch
- 1717 Stoney Creek Arch Unit B
- 1701 Stoney Creek Arch Unit C
- 1709 Stoney Creek Arch Unit D
- 1305 Lake Point Ct
- 921 White Oak Ct N
- 1008 White Oak Ct S
- 1319 River Birch Run S
- 1244 Mill Stream Way
- 1332 Drexel Cir
- 5800 Baynebridge Dr
- 2565 Fieldsway Dr
- 1134 Mill Lake Quarter
- 1149 Turtle Rock Trace
- 2025 Dawnee Brook Trail N
- 2029 Dawnee Brook Trail N
- 2030 Dawnee Brook Trail N
- 2023 Dawnee Brook Trail N
- 2222 Logans Mill Trail
- 2220 Logans Mill Trail
- 2226 Logans Mill Trail
- 2028 Dawnee Brook Trail N
- 2021 Dawnee Brook Trail N
- 2218 Logans Mill Trail
- 2026 Dawnee Brook Trail N
- 2024 Dawnee Brook Trail N
- 2019 Dawnee Brook Trail N
- 2022 Dawnee Brook Trail N
- 2216 Logans Mill Trail
- 2020 Dawnee Brook Trail N
- 2214 Logans Mill Trail
- 2017 Dawnee Brook Trail N
- 1929 Shepherds Gate
- 2018 Dawnee Brook Trail N