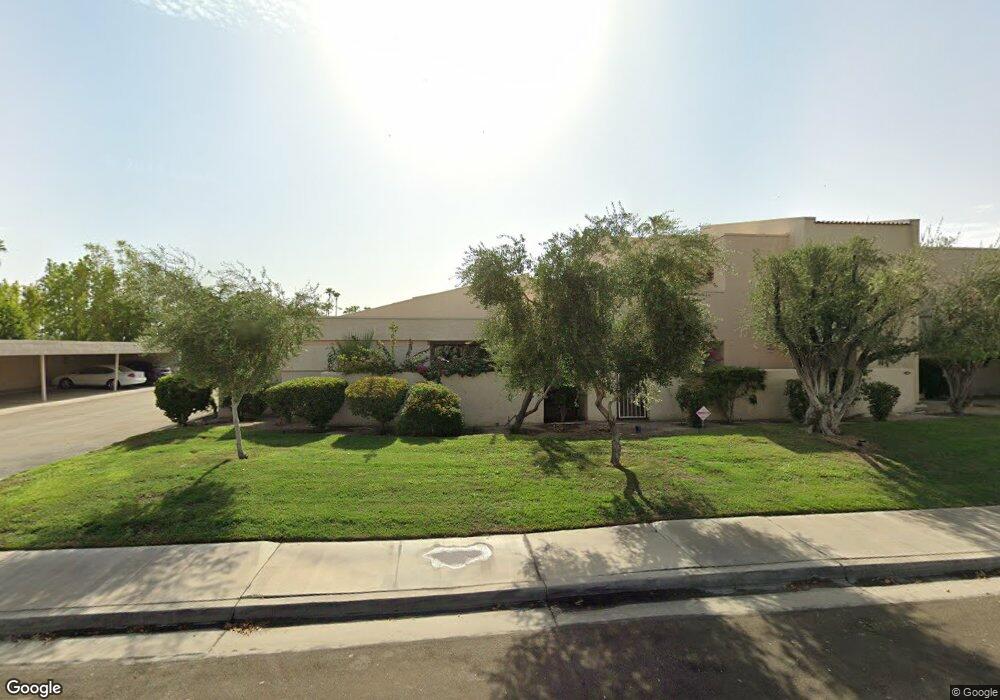
2027 E Columbard Dr Palm Springs, CA 92264
Sonora Sunrise NeighborhoodEstimated Value: $391,142 - $443,000
2
Beds
2
Baths
1,305
Sq Ft
$321/Sq Ft
Est. Value
About This Home
This home is located at 2027 E Columbard Dr, Palm Springs, CA 92264 and is currently estimated at $419,036, approximately $321 per square foot. 2027 E Columbard Dr is a home located in Riverside County with nearby schools including Cahuilla Elementary School, Raymond Cree Middle School, and Palm Springs High School.
Ownership History
Date
Name
Owned For
Owner Type
Purchase Details
Closed on
Jul 7, 2009
Sold by
Scorziell Lisa M
Bought by
Powell Garry A and Powell Susan Green
Current Estimated Value
Purchase Details
Closed on
Oct 15, 2002
Sold by
Scorziell Lisa M
Bought by
Scorziell Lisa M
Purchase Details
Closed on
Apr 24, 2002
Sold by
Scorziell Eugene
Bought by
Scorziell Lisa M
Purchase Details
Closed on
Sep 13, 1999
Sold by
Cianciarulo Anthony M and Cianciarulo Constance G
Bought by
Styborski Edward F
Home Financials for this Owner
Home Financials are based on the most recent Mortgage that was taken out on this home.
Original Mortgage
$81,900
Interest Rate
7.77%
Mortgage Type
Purchase Money Mortgage
Purchase Details
Closed on
Oct 18, 1994
Sold by
Gibson Living Trust Utd 022190
Bought by
Cianciarulo Anthony M and Cianciarulo Constance G
Create a Home Valuation Report for This Property
The Home Valuation Report is an in-depth analysis detailing your home's value as well as a comparison with similar homes in the area
Home Values in the Area
Average Home Value in this Area
Purchase History
| Date | Buyer | Sale Price | Title Company |
|---|---|---|---|
| Powell Garry A | $165,000 | First American Title Company | |
| Scorziell Lisa M | -- | -- | |
| Scorziell Lisa M | -- | First American Title Co | |
| Scorziell Lisa M | $126,000 | First American Title Co | |
| Styborski Edward F | $91,000 | First American Title Co | |
| Cianciarulo Anthony M | -- | First American Title Co |
Source: Public Records
Mortgage History
| Date | Status | Borrower | Loan Amount |
|---|---|---|---|
| Previous Owner | Styborski Edward F | $81,900 |
Source: Public Records
Tax History Compared to Growth
Tax History
| Year | Tax Paid | Tax Assessment Tax Assessment Total Assessment is a certain percentage of the fair market value that is determined by local assessors to be the total taxable value of land and additions on the property. | Land | Improvement |
|---|---|---|---|---|
| 2025 | $2,791 | $212,965 | $53,235 | $159,730 |
| 2023 | $2,791 | $204,698 | $51,169 | $153,529 |
| 2022 | $2,844 | $200,685 | $50,166 | $150,519 |
| 2021 | $2,790 | $196,751 | $49,183 | $147,568 |
| 2020 | $2,672 | $194,734 | $48,679 | $146,055 |
| 2019 | $2,630 | $190,917 | $47,725 | $143,192 |
| 2018 | $2,584 | $187,175 | $46,791 | $140,384 |
| 2017 | $2,549 | $183,506 | $45,874 | $137,632 |
| 2016 | $2,480 | $179,909 | $44,975 | $134,934 |
| 2015 | $2,374 | $177,208 | $44,300 | $132,908 |
| 2014 | $2,332 | $173,738 | $43,433 | $130,305 |
Source: Public Records
Map
Nearby Homes
- 1621 S Cerritos Dr
- 1602 S Andee Dr Unit 65
- 1680 S Andee Dr
- 1602 S Cerritos Dr Unit C
- 1975 E Mark Leslie Dr
- 1732 Capri Cir
- 1729 Capri Cir
- 1719 Capri Cir
- 1630 S La Reina Way Unit 3C
- 1645 S Sunrise Way
- 1657 S Sunrise Way
- 2371 Via Sonoma Unit B
- 2454 E Palm Canyon Dr Unit 1A
- 2424 E Palm Canyon Dr Unit 2D
- 2232 Oakcrest Dr
- 2455 Via Sonoma Unit F
- 1207 Antigua Cir
- 1731 Grand Bahama Dr W
- 1655 E Palm Canyon Dr Unit 616
- 1655 E Palm Canyon Dr Unit 308
- 2021 E Columbard Dr
- 2017 E Columbard Dr
- 2051 E Colombard Dr
- 2051 E Columbard Dr
- 2047 E Columbard Dr
- 2011 E Columbard Dr
- 2007 E Columbard Dr Unit 52
- 2007 E Colombard Dr Unit 52
- 2007 E Colombard Dr
- 2061 E Columbard Dr Unit 45
- 2057 E Columbard Dr Unit 44
- 2038 Normandy Ct
- 2067 E Colombard Dr
- 2067 E Columbard Dr
- 2071 E Columbard Dr
- 2032 Normandy Ct
- 2026 Normandy Ct Unit 55
- 2030 Normandy Ct
- 2020 Normandy Ct
- 1591 S Cerritos Dr