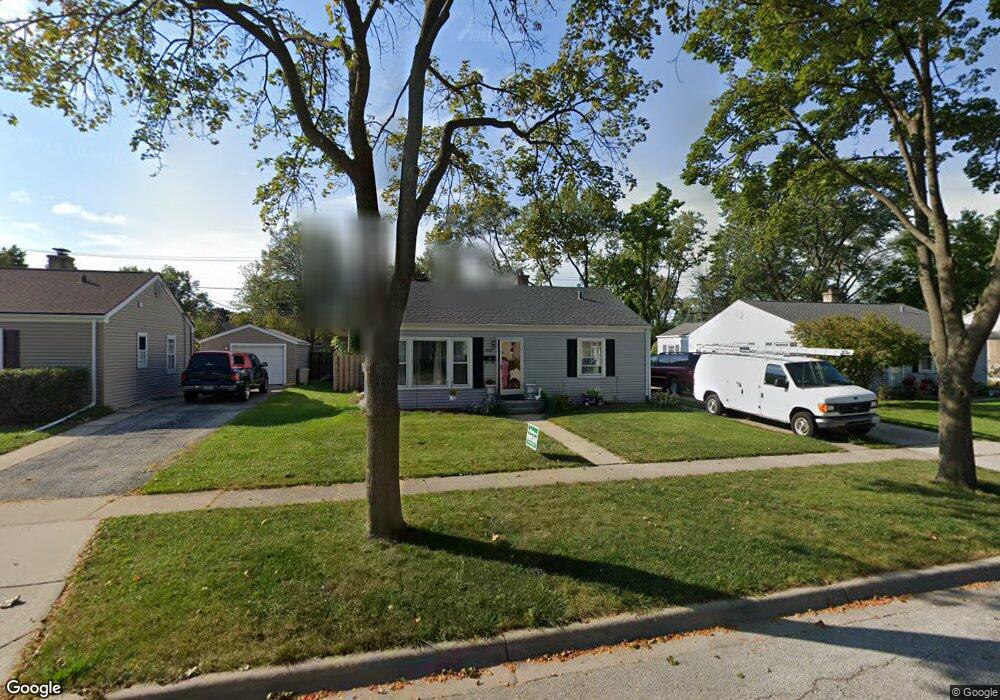
2027 Fargo Ave Des Plaines, IL 60018
Estimated Value: $304,004 - $351,000
3
Beds
1
Bath
910
Sq Ft
$351/Sq Ft
Est. Value
About This Home
This home is located at 2027 Fargo Ave, Des Plaines, IL 60018 and is currently estimated at $319,751, approximately $351 per square foot. 2027 Fargo Ave is a home located in Cook County with nearby schools including South Elementary School, Algonquin Middle School, and Maine West High School.
Ownership History
Date
Name
Owned For
Owner Type
Purchase Details
Closed on
May 24, 2016
Sold by
Weld Michael W and Weld Juvy Vista
Bought by
Weld Michael W and Weld Juvy Vista
Current Estimated Value
Home Financials for this Owner
Home Financials are based on the most recent Mortgage that was taken out on this home.
Original Mortgage
$199,885
Outstanding Balance
$159,587
Interest Rate
3.75%
Mortgage Type
VA
Estimated Equity
$160,164
Purchase Details
Closed on
Jul 27, 2012
Sold by
Harris David Jeffrey
Bought by
Weid Michael W
Home Financials for this Owner
Home Financials are based on the most recent Mortgage that was taken out on this home.
Original Mortgage
$175,650
Interest Rate
3.65%
Mortgage Type
VA
Purchase Details
Closed on
Dec 30, 2004
Sold by
Harris David Jeffrey
Bought by
Harris David Jeffrey and Harris David John
Purchase Details
Closed on
Nov 20, 1996
Sold by
Kraft Margaret H
Bought by
Harris Mary and Harris David Jeffrey
Create a Home Valuation Report for This Property
The Home Valuation Report is an in-depth analysis detailing your home's value as well as a comparison with similar homes in the area
Home Values in the Area
Average Home Value in this Area
Purchase History
| Date | Buyer | Sale Price | Title Company |
|---|---|---|---|
| Weld Michael W | -- | Attorney | |
| Weid Michael W | $175,000 | None Available | |
| Harris David Jeffrey | -- | -- | |
| Harris Mary | $135,000 | -- |
Source: Public Records
Mortgage History
| Date | Status | Borrower | Loan Amount |
|---|---|---|---|
| Open | Weld Michael W | $199,885 | |
| Closed | Weid Michael W | $175,650 |
Source: Public Records
Tax History Compared to Growth
Tax History
| Year | Tax Paid | Tax Assessment Tax Assessment Total Assessment is a certain percentage of the fair market value that is determined by local assessors to be the total taxable value of land and additions on the property. | Land | Improvement |
|---|---|---|---|---|
| 2024 | $5,190 | $23,000 | $5,400 | $17,600 |
| 2023 | $5,038 | $23,000 | $5,400 | $17,600 |
| 2022 | $5,038 | $23,000 | $5,400 | $17,600 |
| 2021 | $4,182 | $16,934 | $4,500 | $12,434 |
| 2020 | $4,180 | $16,934 | $4,500 | $12,434 |
| 2019 | $4,198 | $19,028 | $4,500 | $14,528 |
| 2018 | $4,753 | $19,327 | $3,960 | $15,367 |
| 2017 | $4,686 | $19,327 | $3,960 | $15,367 |
| 2016 | $5,371 | $19,327 | $3,960 | $15,367 |
| 2015 | $5,258 | $17,392 | $3,420 | $13,972 |
| 2014 | $5,147 | $17,392 | $3,420 | $13,972 |
| 2013 | $5,019 | $17,392 | $3,420 | $13,972 |
Source: Public Records
Map
Nearby Homes
- 38 E Touhy Ave
- 1966 Laura Ln
- 1706 Buckingham Dr
- 2500 Maple St
- 2126 David Dr
- 2609 Eisenhower Dr
- 1928 Kennicott Ct
- 1641 E Touhy Ave
- 1629 E Touhy Ave
- 2646 Maple St
- 1640 S River Rd
- 22 Park Ln Unit 203
- 44 Park Ln Unit 435
- 1721 Linden St
- 300 Boardwalk Place Unit T300
- 1757 Farwell Ave
- 2017 Pine St Unit B
- 1724 Illinois St
- 200 Thames Pkwy Unit 1
- 1689 S Elm St
- 2035 Fargo Ave
- 2019 Fargo Ave
- 2043 Fargo Ave
- 2009 Fargo Ave
- 2208 Magnolia St
- 2049 Fargo Ave
- 1999 Fargo Ave
- 2030 Fargo Ave
- 2207 S Scott St
- 2020 Fargo Ave
- 2038 Fargo Ave
- 2216 Magnolia St
- 2010 Fargo Ave
- 2044 Fargo Ave
- 2215 S Scott St
- 2059 Fargo Ave
- 1989 Fargo Ave
- 2199 Magnolia St
- 2224 Magnolia St
- 2000 Fargo Ave