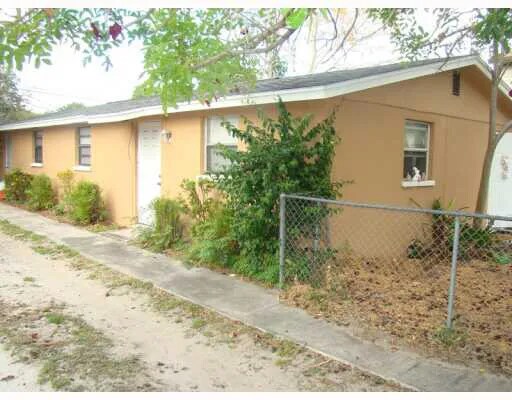
NOT LISTED FOR SALE

Estimated Value: $300,000 - $362,000

2 Beds
1 Bath
1,441 Sq Ft
$225/Sq Ft Est. Value

About This Home

This home is located at 2027 Florinda St Unit 1, Sarasota, FL 34231 and is currently estimated at $324,206, approximately $224 per square foot. 2027 Florinda St Unit 1 is a home located in Sarasota County with nearby schools including Phillippi Shores Elementary School, Riverview High School, and Brookside Middle School.

Ownership History

Date Name Owned For Owner Type

Purchase Details

Closed on
May 5, 2009
Sold by
Poaps Thomas M
Bought by
Flanagan Mark
Current Estimated Value
$324,206

Purchase Details

Closed on
May 15, 2002
Sold by
Gulf Coast Parking Co
Bought by
Poaps Thomas M

Purchase Details

Closed on
May 10, 2002
Sold by
Butler Steven M
Bought by
Gulf Coast Parking Co

Purchase Details

Closed on
Oct 5, 1998
Sold by
Federal Home Loan Mortgage Corporation
Bought by
Butler Steven M

Home Financials for this Owner

Home Financials are based on the most recent Mortgage that was taken out on this home.
Original Mortgage
$63,900
Interest Rate
6.95%

Purchase Details

Closed on
Aug 12, 1998
Sold by
Clerk Circuit Court
Bought by
Federal Home Loan Mortgage Corporation

Home Financials for this Owner

Home Financials are based on the most recent Mortgage that was taken out on this home.
Original Mortgage
$63,900
Interest Rate
6.95%

Purchase Details

Closed on
Jul 20, 1998
Sold by
Clerk Circuit Court
Bought by
Liberty Lending Svc
Source: Public Records

Range of Values:

Collateral Analytics

Collateral Analytics Collateral Analytics AVMs (Automated Valuation Model) employ a number of statistical approaches combined with neighborhood-specific comparable selection guarantees the most up-to-date and precise valuations.

Not Available

Collateral Analytics does not have data for the current month. Please view the chart for historical values.

ICE

ICE Mortgage Technology ICE Mortgage Technology’s AVM (Automated Valuation Model) is a state-of-the-art online residential property valuation tool that provides a quick and accurate estimate of the value of almost any home in the U.S.

Not Available

ICE Mortgage Technology does not have data for the current month. Please view the chart for historical values.

First American

First American First American Data & Analytics’ next-generation AVM combines unrivaled data assets with a blended ensemble of valuation models to produce highly accurate, reliable valuations you can trust.

Not Available

First American does not have data for the current month. Please view the chart for historical values.

Quantarium

Quantarium Quantarium’s valuation service, repeatedly proven the industry’s most accurate and comprehensive, is supercharged with a self-learning and auto-tuning AI engine that continually becomes smarter and more accurate as it processes daily inputs from the industry’s leading RE data lake.

Not Available

Quantarium does not have data for the current month. Please view the chart for historical values.

Average Value
Not Available
List Price
Sold Price
Create a Home Valuation Report for This Property
The Home Valuation Report is an in-depth analysis detailing your home's value as well as a comparison with similar homes in the area

Home Values in the Area

Source: Public Records

Average Home Value in this Area


Source: Public Records

Purchase History

Date Buyer Sale Price Title Company
Flanagan Mark $102,000 Attorney
Poaps Thomas M -- --
Gulf Coast Parking Co $130,000 --
Butler Steven M $79,900 --
Federal Home Loan Mortgage Corporation -- --
Liberty Lending Svc -- --
Source: Public Records

Mortgage History

Date Status Borrower Loan Amount
Previous Owner Butler Steven M $75,000
Previous Owner Butler Steven M $63,900
Source: Public Records

Tax History Compared to Growth

Source: Public Records

Tax History

Year Tax Paid Tax Assessment Tax Assessment Total Assessment is a certain percentage of the fair market value that is determined by local assessors to be the total taxable value of land and additions on the property. Land Improvement
2024 $3,482 $194,916 -- --
2023 $3,482 $262,200 $148,700 $113,500
2022 $3,081 $210,700 $106,400 $104,300
2021 $2,797 $165,400 $72,300 $93,100
2020 $2,556 $139,300 $54,500 $84,800
2019 $2,183 $112,300 $60,000 $52,300
2018 $2,202 $119,700 $60,000 $59,700
2017 $2,099 $105,282 $0 $0
2016 $2,021 $103,700 $46,600 $57,100
2015 $2,010 $103,900 $41,200 $62,700
2014 $1,780 $72,300 $0 $0
Source: Public Records

Map