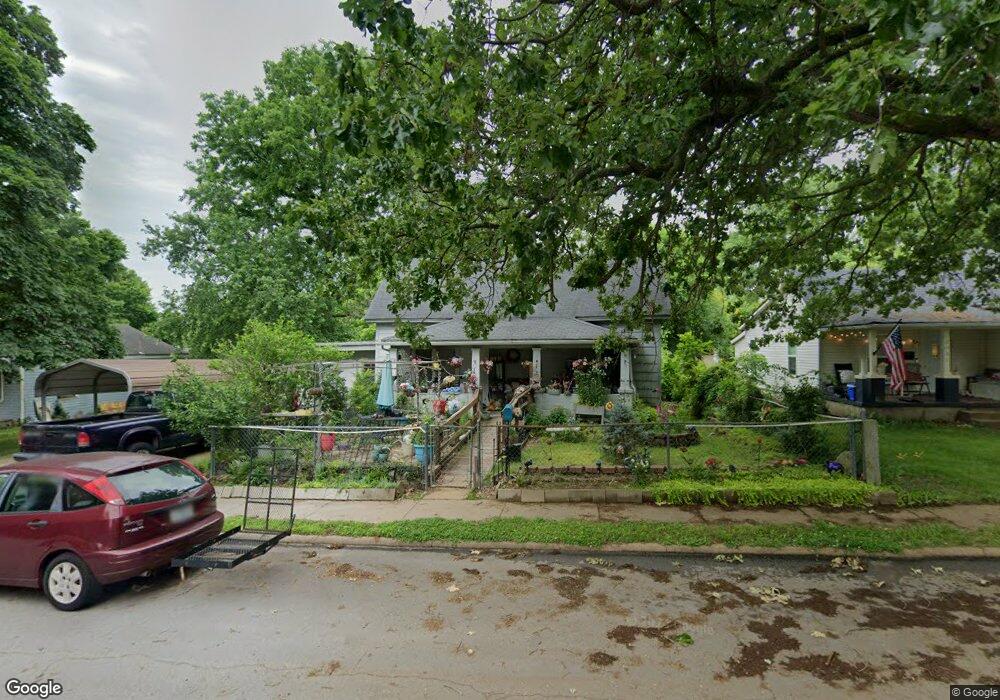
2027 N Pickwick Ave Springfield, MO 65803
Robberson NeighborhoodEstimated Value: $113,000 - $133,000
2
Beds
1
Bath
1,208
Sq Ft
$104/Sq Ft
Est. Value
About This Home
This home is located at 2027 N Pickwick Ave, Springfield, MO 65803 and is currently estimated at $125,956, approximately $104 per square foot. 2027 N Pickwick Ave is a home located in Greene County with nearby schools including Fremont Elementary School, Reed Academy, and Hillcrest High School.
Ownership History
Date
Name
Owned For
Owner Type
Purchase Details
Closed on
Apr 11, 2019
Sold by
Capler Timetta and Courtway Tina
Bought by
Capler Timetta A and Courtway Tina
Current Estimated Value
Purchase Details
Closed on
May 18, 2016
Sold by
Cook Hunter
Bought by
Capler Timetta and Courtway Tina
Home Financials for this Owner
Home Financials are based on the most recent Mortgage that was taken out on this home.
Original Mortgage
$36,329
Outstanding Balance
$29,227
Interest Rate
3.99%
Mortgage Type
FHA
Estimated Equity
$96,729
Purchase Details
Closed on
Jul 8, 2008
Sold by
Berry Christopher James
Bought by
Cook Hunter
Purchase Details
Closed on
Jul 2, 2008
Sold by
Berry Christopher James
Bought by
Berry Christopher James
Purchase Details
Closed on
Sep 15, 2006
Sold by
Berry James Allen and Berry Beverly Louise
Bought by
Berry Christopher James
Create a Home Valuation Report for This Property
The Home Valuation Report is an in-depth analysis detailing your home's value as well as a comparison with similar homes in the area
Home Values in the Area
Average Home Value in this Area
Purchase History
| Date | Buyer | Sale Price | Title Company |
|---|---|---|---|
| Capler Timetta A | -- | None Available | |
| Capler Timetta | $37,000 | Netco | |
| Cook Hunter | -- | Tri Lakes Metro Title Compan | |
| Berry Christopher James | -- | None Available | |
| Berry Christopher James | -- | None Available |
Source: Public Records
Mortgage History
| Date | Status | Borrower | Loan Amount |
|---|---|---|---|
| Open | Capler Timetta | $36,329 |
Source: Public Records
Tax History
| Year | Tax Paid | Tax Assessment Tax Assessment Total Assessment is a certain percentage of the fair market value that is determined by local assessors to be the total taxable value of land and additions on the property. | Land | Improvement |
|---|---|---|---|---|
| 2025 | $620 | $12,440 | $4,920 | $7,520 |
| 2024 | $564 | $10,520 | $3,570 | $6,950 |
| 2023 | $561 | $10,520 | $3,570 | $6,950 |
| 2022 | $544 | $9,970 | $3,570 | $6,400 |
| 2021 | $544 | $9,970 | $3,570 | $6,400 |
| 2020 | $531 | $9,290 | $3,570 | $5,720 |
| 2019 | $516 | $9,290 | $3,570 | $5,720 |
| 2018 | $443 | $7,980 | $3,570 | $4,410 |
| 2017 | $438 | $7,980 | $3,570 | $4,410 |
| 2016 | $437 | $7,980 | $3,570 | $4,410 |
| 2015 | $433 | $7,980 | $3,570 | $4,410 |
| 2014 | $424 | $7,750 | $3,570 | $4,180 |
Source: Public Records
Map
Nearby Homes
- 2045 N Weller Ave
- 2030 N Fremont Ave
- 2115 N Weller Ave
- 1438 E Florida St
- 1448 E Florida St
- 1628 E Adams St
- 2617 N Prospect Ave
- 2224 N Rogers Ave
- 2010 N Ramsey Ave
- 2055 N Ramsey Ave
- 1638 E Florida St
- 2129 N Kentwood Ave
- 2202 N Ramsey Ave
- 1547 E Florida St
- 1604 E Commercial St
- 1719 N Weller Ave
- 1342 E Blaine St
- 1309 E Blaine St
- 1606 E Blaine St
- 2023 N Taylor Ave
- 2031 N Pickwick Ave
- 2019 N Pickwick Ave
- 2015 N Pickwick Ave
- 2035 N Pickwick Ave
- 2011 N Pickwick Ave
- 2039 N Pickwick Ave
- 2020 N Fremont Ave
- 2041 N Pickwick Ave
- 2016 N Fremont Ave
- 2005 N Pickwick Ave
- 2036 N Fremont Ave
- 2012 N Fremont Ave
- 2026 N Pickwick Ave
- 2030 N Pickwick Ave
- 2016 N Pickwick Ave
- 2010 N Fremont Ave
- 2047 N Pickwick Ave
- 2040 N Fremont Ave
- 2036 N Pickwick Ave
- 2001 N Pickwick Ave
Your Personal Tour Guide
Ask me questions while you tour the home.