Estimated Value: $595,000 - $716,000
4
Beds
5
Baths
3,309
Sq Ft
$194/Sq Ft
Est. Value
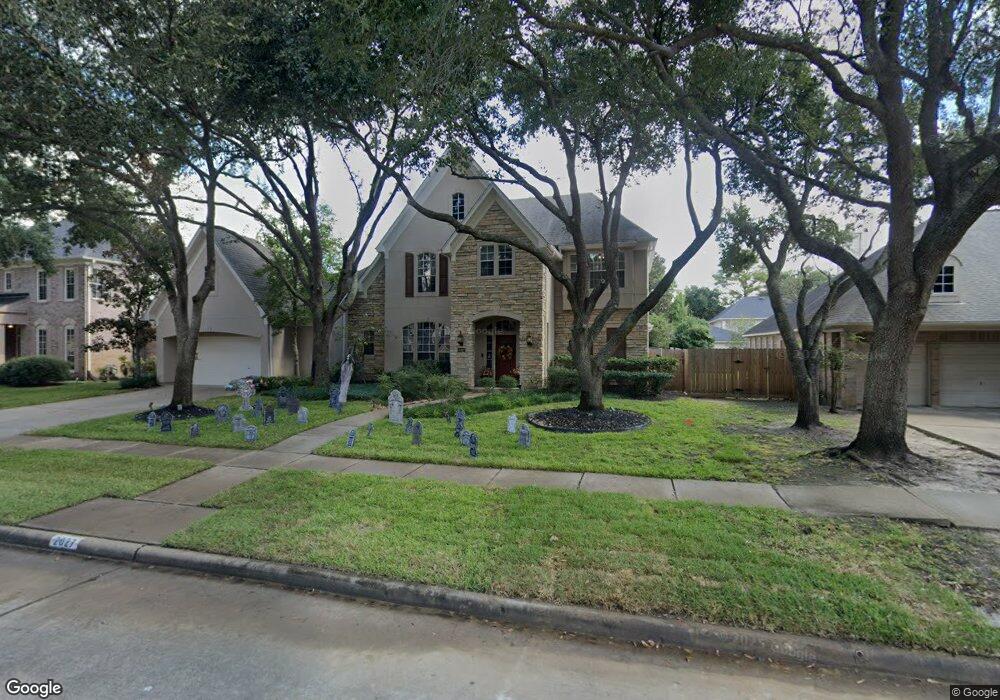
About This Home
This home is located at 2027 Royal Downs Dr, Katy, TX 77450 and is currently estimated at $643,010, approximately $194 per square foot. 2027 Royal Downs Dr is a home located in Fort Bend County with nearby schools including James E Williams Elementary School, Rodger & Ellen Beck Junior High, and Cinco Ranch High School.
Ownership History
Date
Name
Owned For
Owner Type
Purchase Details
Closed on
Apr 13, 2011
Sold by
Cockrell Lisa Jean
Bought by
Cockrell Robert Andrew
Current Estimated Value
Purchase Details
Closed on
Jul 25, 2008
Sold by
Dineen John P and Dineen Robin L
Bought by
Cockrell Robert A
Home Financials for this Owner
Home Financials are based on the most recent Mortgage that was taken out on this home.
Original Mortgage
$296,840
Outstanding Balance
$194,296
Interest Rate
6.36%
Mortgage Type
Purchase Money Mortgage
Estimated Equity
$448,714
Purchase Details
Closed on
Oct 4, 1996
Sold by
Houston Village Builders Inc
Bought by
Dineen John P and Dineen Robin L
Home Financials for this Owner
Home Financials are based on the most recent Mortgage that was taken out on this home.
Original Mortgage
$207,000
Interest Rate
8.09%
Mortgage Type
Balloon
Purchase Details
Closed on
May 13, 1996
Sold by
Cinco Ranch East Development Inc
Bought by
Houston Village Builders Inc
Create a Home Valuation Report for This Property
The Home Valuation Report is an in-depth analysis detailing your home's value as well as a comparison with similar homes in the area
Home Values in the Area
Average Home Value in this Area
Purchase History
| Date | Buyer | Sale Price | Title Company |
|---|---|---|---|
| Cockrell Robert Andrew | -- | None Available | |
| Cockrell Robert A | -- | First American Title | |
| Dineen John P | -- | Regency Title Company | |
| Cockrell Robert A | -- | -- | |
| Houston Village Builders Inc | -- | Commonwealth Land Title Co |
Source: Public Records
Mortgage History
| Date | Status | Borrower | Loan Amount |
|---|---|---|---|
| Open | Cockrell Robert A | $296,840 | |
| Previous Owner | Cockrell Robert A | $207,000 | |
| Closed | Cockrell Robert Andrew | $0 |
Source: Public Records
Tax History
| Year | Tax Paid | Tax Assessment Tax Assessment Total Assessment is a certain percentage of the fair market value that is determined by local assessors to be the total taxable value of land and additions on the property. | Land | Improvement |
|---|---|---|---|---|
| 2025 | $7,922 | $574,254 | $78,000 | $496,254 |
| 2024 | $7,922 | $524,620 | $31,226 | $493,394 |
| 2023 | $7,226 | $476,927 | $0 | $504,668 |
| 2022 | $7,028 | $433,570 | $0 | $473,950 |
| 2021 | $8,689 | $394,150 | $60,000 | $334,150 |
| 2020 | $8,494 | $378,840 | $50,000 | $328,840 |
| 2019 | $9,504 | $399,240 | $50,000 | $349,240 |
| 2018 | $9,737 | $408,490 | $50,000 | $358,490 |
| 2017 | $9,381 | $392,730 | $50,000 | $342,730 |
| 2016 | $8,978 | $375,880 | $50,000 | $325,880 |
| 2015 | $7,315 | $387,860 | $50,000 | $337,860 |
| 2014 | $6,826 | $352,600 | $50,000 | $302,600 |
Source: Public Records
Map
Nearby Homes
- 2114 Lytham Ln
- 2106 White Eagle Ln
- 2206 Winberie Ct
- 2130 White Eagle Ln
- 22806 Two Rivers Ln
- 1910 Landon Point Cir
- 22523 Wildwood Grove Dr
- 22015 Fielder Dr
- 1802 Field Briar Dr
- 22726 Blue Canyon Dr
- 22002 Treesdale Ln
- 1723 Cornerstone Place Dr
- 22010 Rockchester Dr
- 2206 Lashley Ct
- 22706 Moonlit Lake Ct
- 2111 Shadow Park Dr
- 22027 Eagle Meadow Dr
- 2034 Bluffton Ln
- 22723 Castleton Creek Ct
- 23027 Lodgepoint Dr
- 2023 Royal Downs Dr
- 2010 Lytham Ln
- 2006 Lytham Ln
- 2014 Lytham Ln
- 2019 Royal Downs Dr
- 2006 Lytham Ln
- 2026 Royal Downs Dr
- 2022 Royal Downs Dr
- 2030 Royal Downs Dr
- 2107 Royal Adelaide Dr
- 2018 Royal Downs Dr
- 2002 Lytham Ln
- 2011 Royal Downs Dr
- 2011 Lytham Ln
- 2102 Lytham Ln
- 2014 Royal Downs Dr
- 2106 Royal Adelaide Dr
- 2111 Royal Adelaide Dr
- 2007 Royal Downs Dr
- 2015 Lytham Ln
Your Personal Tour Guide
Ask me questions while you tour the home.