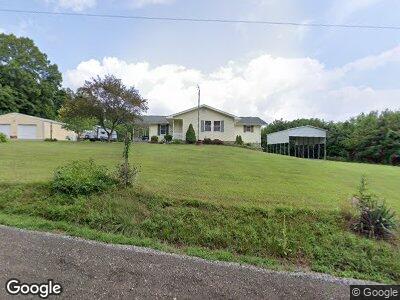
20270 Carroll Rd Rockbridge, OH 43149
Estimated Value: $331,645 - $1,557,000
--
Bed
1
Bath
2,968
Sq Ft
$251/Sq Ft
Est. Value
About This Home
This home is located at 20270 Carroll Rd, Rockbridge, OH 43149 and is currently estimated at $743,882, approximately $250 per square foot. 20270 Carroll Rd is a home located in Hocking County with nearby schools including Logan Elm High School.
Create a Home Valuation Report for This Property
The Home Valuation Report is an in-depth analysis detailing your home's value as well as a comparison with similar homes in the area
Home Values in the Area
Average Home Value in this Area
Mortgage History
| Date | Status | Borrower | Loan Amount |
|---|---|---|---|
| Closed | Carvinee John H | $65,000 | |
| Closed | Cavinee John H | $37,903 |
Source: Public Records
Tax History Compared to Growth
Tax History
| Year | Tax Paid | Tax Assessment Tax Assessment Total Assessment is a certain percentage of the fair market value that is determined by local assessors to be the total taxable value of land and additions on the property. | Land | Improvement |
|---|---|---|---|---|
| 2024 | $2,878 | $72,850 | $16,880 | $55,970 |
| 2023 | $2,878 | $72,850 | $16,880 | $55,970 |
| 2022 | $2,985 | $72,850 | $16,880 | $55,970 |
| 2021 | $2,281 | $51,120 | $10,650 | $40,470 |
| 2020 | $2,305 | $51,120 | $10,650 | $40,470 |
| 2019 | $2,314 | $51,120 | $10,650 | $40,470 |
| 2018 | $2,169 | $46,490 | $8,480 | $38,010 |
| 2017 | $1,788 | $46,490 | $8,480 | $38,010 |
| 2016 | $1,766 | $46,490 | $8,480 | $38,010 |
| 2015 | $1,751 | $45,460 | $8,700 | $36,760 |
| 2014 | $1,751 | $45,460 | $8,700 | $36,760 |
| 2013 | $1,770 | $45,460 | $8,700 | $36,760 |
Source: Public Records
Map
Nearby Homes
- 14212 Long Run Rd
- 20358 Buena Vista Rd
- 14091 Jack Run Rd
- 18811 Indigo Ln
- 0 Clapper Hollow Rd
- 14485 Jack Run Rd
- 15586 Stump Run
- 15574 Long Run Rd
- 10295 Lookout Rd SW
- 12183 Young Rd
- 14635 Little Cola Rd
- 22037 Ohio 180
- 9385 Rich Hollow Rd SW
- 4273 Pine Grove Rd SW
- 23402 Bigham Rd
- 13427 Ohio 374
- 4120 Drinkle Rd SW
- 19683 Thompson Ridge Rd
- 18221 Wagner Rd
- 16862 Karshner Rd