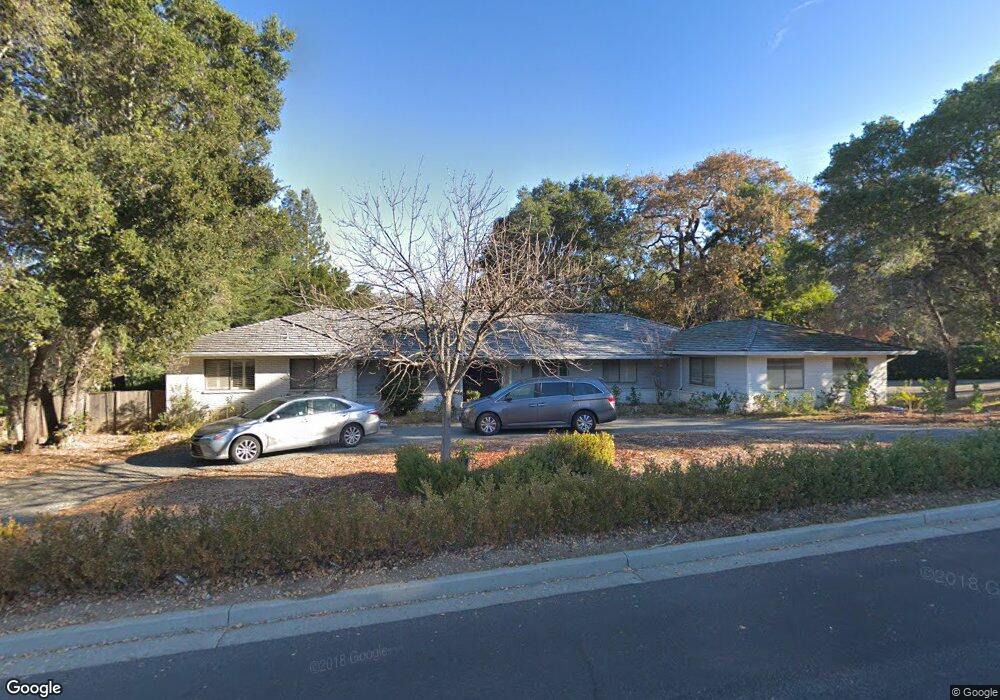
20271 Calle Montalvo Saratoga, CA 95070
Montalvo NeighborhoodEstimated Value: $3,520,000 - $4,868,900
4
Beds
2
Baths
2,813
Sq Ft
$1,548/Sq Ft
Est. Value
About This Home
This home is located at 20271 Calle Montalvo, Saratoga, CA 95070 and is currently estimated at $4,355,725, approximately $1,548 per square foot. 20271 Calle Montalvo is a home located in Santa Clara County with nearby schools including Saratoga Elementary School, Foothill Elementary School, and Argonaut Elementary School.
Ownership History
Date
Name
Owned For
Owner Type
Purchase Details
Closed on
Dec 19, 2017
Sold by
Liu Liping
Bought by
Lin Hengheng
Current Estimated Value
Home Financials for this Owner
Home Financials are based on the most recent Mortgage that was taken out on this home.
Original Mortgage
$600,000
Outstanding Balance
$156,326
Interest Rate
3.95%
Mortgage Type
New Conventional
Estimated Equity
$4,199,399
Purchase Details
Closed on
Nov 21, 2014
Sold by
Lin Hengsheng and Liu Liping
Bought by
Lin Hengsheng
Purchase Details
Closed on
Sep 30, 2005
Sold by
Lin Heng Sheng and Liu Li Ping
Bought by
Lin Hengsheng and Liu Liping
Purchase Details
Closed on
Jul 9, 1999
Sold by
Saroyan Earl M Trustee
Bought by
Lin Heng Sheng and Liu Li Ping
Home Financials for this Owner
Home Financials are based on the most recent Mortgage that was taken out on this home.
Original Mortgage
$1,000,000
Interest Rate
2.95%
Purchase Details
Closed on
Oct 23, 1996
Sold by
Saroyan Earl M
Bought by
Saroyan Earl M
Create a Home Valuation Report for This Property
The Home Valuation Report is an in-depth analysis detailing your home's value as well as a comparison with similar homes in the area
Home Values in the Area
Average Home Value in this Area
Purchase History
| Date | Buyer | Sale Price | Title Company |
|---|---|---|---|
| Lin Hengheng | -- | Old Republic Title Co | |
| Lin Hengsheng | -- | None Available | |
| Lin Hengsheng | -- | -- | |
| Lin Heng Sheng | $1,798,000 | First American Title Guarant | |
| Saroyan Earl M | -- | -- |
Source: Public Records
Mortgage History
| Date | Status | Borrower | Loan Amount |
|---|---|---|---|
| Open | Lin Hengheng | $600,000 | |
| Previous Owner | Lin Heng Sheng | $1,000,000 |
Source: Public Records
Tax History Compared to Growth
Tax History
| Year | Tax Paid | Tax Assessment Tax Assessment Total Assessment is a certain percentage of the fair market value that is determined by local assessors to be the total taxable value of land and additions on the property. | Land | Improvement |
|---|---|---|---|---|
| 2025 | $32,259 | $2,758,879 | $1,690,681 | $1,068,198 |
| 2024 | $32,259 | $2,704,784 | $1,657,531 | $1,047,253 |
| 2023 | $31,972 | $2,651,750 | $1,625,031 | $1,026,719 |
| 2022 | $31,322 | $2,599,756 | $1,593,168 | $1,006,588 |
| 2021 | $30,818 | $2,548,781 | $1,561,930 | $986,851 |
| 2020 | $30,179 | $2,522,648 | $1,545,915 | $976,733 |
| 2019 | $29,677 | $2,473,185 | $1,515,603 | $957,582 |
| 2018 | $29,168 | $2,424,692 | $1,485,886 | $938,806 |
| 2017 | $29,068 | $2,377,150 | $1,456,751 | $920,399 |
| 2016 | $28,239 | $2,330,540 | $1,428,188 | $902,352 |
| 2015 | $27,694 | $2,295,534 | $1,406,736 | $888,798 |
| 2014 | $25,932 | $2,250,569 | $1,379,180 | $871,389 |
Source: Public Records
Map
Nearby Homes
- 20141 Mendelsohn Ln
- 14685 Horseshoe Dr
- 15253 Montalvo Rd
- 14582 Horseshoe Dr
- 14835 Farwell Ave
- 20063 Spaich Ct
- 15906 Cuvilly Way
- 20808 Pamela Way
- 14351 Saratoga Ave Unit A
- 14355 Saratoga Ave Unit A
- 14355 Saratoga Ave Unit B
- 14637 Big Basin Way
- 14333 Saratoga Ave Unit 14
- 14231 Juniper Ln
- 14275 Saratoga Ave
- 19825 Douglass Ln
- 11750 Redwood Trail Unit 61-13 Plan 4
- 11710 Redwood Trail Unit 57-13 Plan 3
- 19661 Saratoga Los Gatos Rd
- 14676 Wild Berry Ln
- 20303 Calle Montalvo
- 14890 Montalvo Rd
- 14821 Montalvo Rd
- 20292 Calle Montalvo
- 20270 Calle Montalvo
- 20315 Calle Montalvo
- 20308 Calle Montalvo
- 14850 Montalvo Rd
- 20231 Bonnie Brae Way
- 14840 Montalvo Rd
- 20316 Calle Montalvo
- 14777 Montalvo Rd
- 14800 Montalvo Rd
- 20191 Bonnie Brae Way
- 28001 Audrey Smith Ln
- 14900 Montalvo Rd
- 14720 Cody Ln
- 14780 Montalvo Rd
- 28011 Audrey Smith Ln
- 20230 Bonnie Brae Way