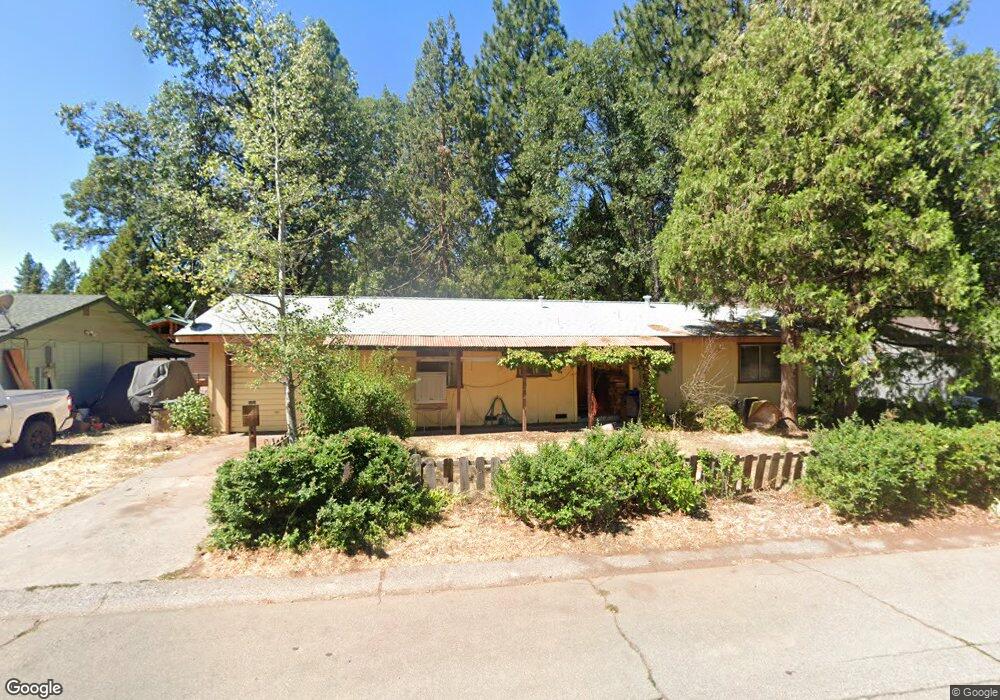
20274 Sugar Pine St Burney, CA 96013
Estimated Value: $181,344 - $203,000
3
Beds
1
Bath
1,104
Sq Ft
$176/Sq Ft
Est. Value
About This Home
This home is located at 20274 Sugar Pine St, Burney, CA 96013 and is currently estimated at $194,586, approximately $176 per square foot. 20274 Sugar Pine St is a home located in Shasta County with nearby schools including Burney Elementary School and Burney Junior/Senior High School.
Ownership History
Date
Name
Owned For
Owner Type
Purchase Details
Closed on
Jul 14, 2003
Sold by
King Andrew Jeffrey
Bought by
King Andrew Jeffrey and King Sandra L
Current Estimated Value
Home Financials for this Owner
Home Financials are based on the most recent Mortgage that was taken out on this home.
Original Mortgage
$35,000
Outstanding Balance
$14,791
Interest Rate
5.18%
Mortgage Type
Purchase Money Mortgage
Estimated Equity
$179,795
Purchase Details
Closed on
Jun 24, 2003
Sold by
Henton Lillian Charlene and King Lillian C
Bought by
King Andrew J
Home Financials for this Owner
Home Financials are based on the most recent Mortgage that was taken out on this home.
Original Mortgage
$35,000
Outstanding Balance
$14,791
Interest Rate
5.18%
Mortgage Type
Purchase Money Mortgage
Estimated Equity
$179,795
Purchase Details
Closed on
Sep 5, 2001
Sold by
Henton Lillian C
Bought by
King Andrew J
Purchase Details
Closed on
Aug 1, 2001
Sold by
Va
Bought by
King Andrew Jeffrey and King Lillian C
Create a Home Valuation Report for This Property
The Home Valuation Report is an in-depth analysis detailing your home's value as well as a comparison with similar homes in the area
Home Values in the Area
Average Home Value in this Area
Purchase History
| Date | Buyer | Sale Price | Title Company |
|---|---|---|---|
| King Andrew Jeffrey | -- | First American Title Co | |
| King Andrew Jeffrey | -- | First American Title Co | |
| King Andrew J | -- | First American Title Co | |
| King Andrew J | -- | -- | |
| King Andrew Jeffrey | -- | -- |
Source: Public Records
Mortgage History
| Date | Status | Borrower | Loan Amount |
|---|---|---|---|
| Open | King Andrew Jeffrey | $35,000 |
Source: Public Records
Tax History
| Year | Tax Paid | Tax Assessment Tax Assessment Total Assessment is a certain percentage of the fair market value that is determined by local assessors to be the total taxable value of land and additions on the property. | Land | Improvement |
|---|---|---|---|---|
| 2025 | $794 | $82,252 | $16,061 | $66,191 |
| 2024 | $782 | $80,641 | $15,747 | $64,894 |
| 2023 | $782 | $79,061 | $15,439 | $63,622 |
| 2022 | $758 | $77,512 | $15,137 | $62,375 |
| 2021 | $740 | $75,993 | $14,841 | $61,152 |
| 2020 | $737 | $75,214 | $14,689 | $60,525 |
| 2019 | $706 | $73,740 | $14,401 | $59,339 |
| 2018 | $733 | $72,295 | $14,119 | $58,176 |
| 2017 | $694 | $70,879 | $13,843 | $57,036 |
| 2016 | $672 | $69,490 | $13,572 | $55,918 |
| 2015 | $657 | $68,448 | $13,369 | $55,079 |
| 2014 | $648 | $67,109 | $13,108 | $54,001 |
Source: Public Records
Map
Nearby Homes
- 20274 Arrowood St
- 37353 & 57 Ponderosa Ave
- 20244 Arrowood St
- 20305 Arrowood St
- 37329 Ponderosa Ave
- 20194 Sugar Pine St
- 37347 Cypress Ave
- 20174 Mapleleaf St
- 20158 Mapleleaf St
- 20344 Hudson St
- 37385 Oak View St
- 010 Kirby Ct
- 007 Kirby Ct
- 011 Kirby Ct
- 20476 Marquette St
- 37176 Washburn Ave
- 37305 California 299
- 20543 Mackinac St
- 37176 Superior Ave Unit A&B
- 20525 Hudson St
- 20266 Sugar Pine St
- 20282 Sugar Pine St
- 20290 Sugar Pine St
- 20269 Sugar Pine St Unit 1
- 20269 Sugar Pine St
- 20258 Sugar Pine St
- 20269 Marquette St
- 20273 Marquette St
- 20275 Sugar Pine St
- 20298 Sugar Pine St
- 20298 Sugar Pine St
- 20263 Sugar Pine St
- 20263 Marquette St
- 20283 Sugar Pine St
- 20250 Sugar Pine St
- 20257 Sugar Pine St
- 20257 Marquette St
- 20291 Sugar Pine St
- 20306 Sugar Pine
- 20251 Sugar Pine St
Your Personal Tour Guide
Ask me questions while you tour the home.