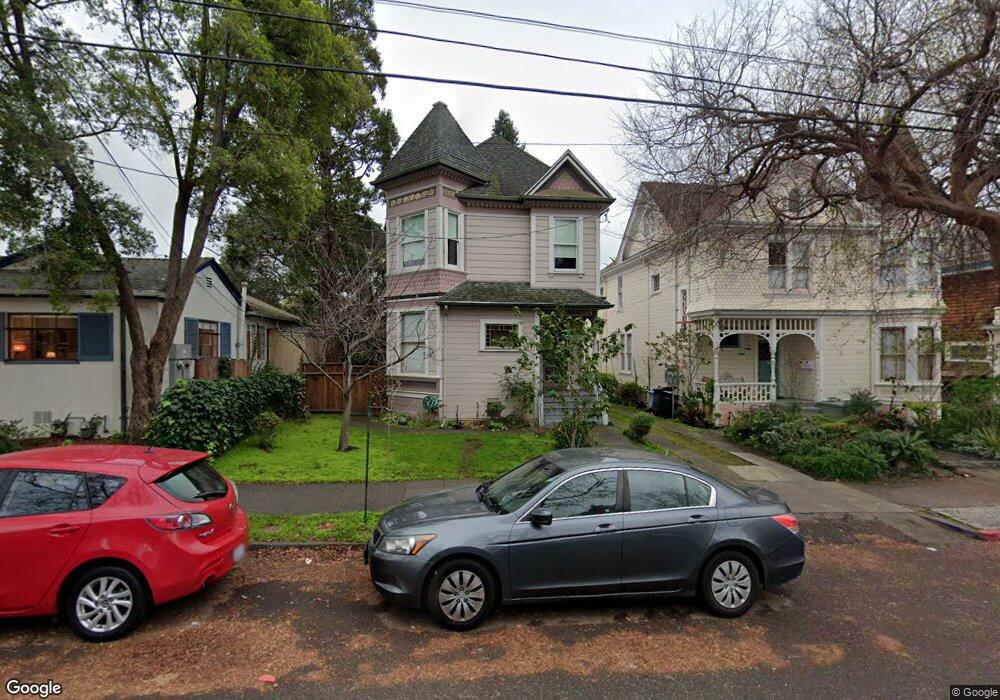
2028 Francisco St Unit 3 Berkeley, CA 94709
North Berkeley NeighborhoodEstimated Value: $710,550 - $770,000
2
Beds
1
Bath
875
Sq Ft
$832/Sq Ft
Est. Value
About This Home
This home is located at 2028 Francisco St Unit 3, Berkeley, CA 94709 and is currently estimated at $727,638, approximately $831 per square foot. 2028 Francisco St Unit 3 is a home located in Alameda County with nearby schools including Berkeley Arts Magnet at Whittier School, Washington Elementary School, and Oxford Elementary School.
Ownership History
Date
Name
Owned For
Owner Type
Purchase Details
Closed on
Apr 3, 2023
Sold by
Renshaw Vernon and Renshaw Maria Andita
Bought by
Renshaw Family Trust
Current Estimated Value
Purchase Details
Closed on
Aug 1, 2022
Sold by
Renshaw and Maan
Bought by
Renshaw Vernon and Renshaw Maan
Purchase Details
Closed on
Sep 25, 2019
Sold by
Hunt Cheryl Boyce and Boyce Cheryl L
Bought by
Renshaw Vernon and Barcelo Maria Andita H
Purchase Details
Closed on
Jun 10, 2005
Sold by
Jensen Joshua P and Lusk Heather
Bought by
Boyce Cheryl L
Home Financials for this Owner
Home Financials are based on the most recent Mortgage that was taken out on this home.
Original Mortgage
$384,000
Interest Rate
5.72%
Mortgage Type
Fannie Mae Freddie Mac
Purchase Details
Closed on
Dec 1, 2003
Sold by
Herscher Elaine C
Bought by
Jensen Joshua P and Lusk Heather
Create a Home Valuation Report for This Property
The Home Valuation Report is an in-depth analysis detailing your home's value as well as a comparison with similar homes in the area
Home Values in the Area
Average Home Value in this Area
Purchase History
| Date | Buyer | Sale Price | Title Company |
|---|---|---|---|
| Renshaw Family Trust | -- | None Listed On Document | |
| Renshaw Vernon | -- | None Listed On Document | |
| Renshaw Vernon | $500,000 | Placer Title Company | |
| Boyce Cheryl L | $480,000 | Old Republic Title Company | |
| Jensen Joshua P | $365,000 | Fidelity National Title Co |
Source: Public Records
Mortgage History
| Date | Status | Borrower | Loan Amount |
|---|---|---|---|
| Previous Owner | Boyce Cheryl L | $384,000 |
Source: Public Records
Tax History
| Year | Tax Paid | Tax Assessment Tax Assessment Total Assessment is a certain percentage of the fair market value that is determined by local assessors to be the total taxable value of land and additions on the property. | Land | Improvement |
|---|---|---|---|---|
| 2025 | $11,089 | $692,922 | $174,980 | $524,942 |
| 2024 | $11,089 | $679,201 | $171,550 | $514,651 |
| 2023 | $10,853 | $672,748 | $168,187 | $504,561 |
| 2022 | $10,647 | $652,557 | $164,889 | $494,668 |
| 2021 | $10,665 | $639,629 | $161,657 | $484,972 |
| 2020 | $10,065 | $640,000 | $160,000 | $480,000 |
| 2019 | $9,301 | $599,750 | $179,925 | $419,825 |
| 2018 | $9,138 | $587,994 | $176,398 | $411,596 |
| 2017 | $8,817 | $576,470 | $172,941 | $403,529 |
| 2016 | $8,508 | $565,170 | $169,551 | $395,619 |
| 2015 | $8,391 | $556,684 | $167,005 | $389,679 |
| 2014 | $7,877 | $510,000 | $153,000 | $357,000 |
Source: Public Records
Map
Nearby Homes
- 1610 Milvia St
- 1609 Bonita Ave Unit 5
- 1625 Martin Luther King jr Way
- 1682 Oxford St
- 2201 Virginia St Unit 2
- 1739 Spruce St
- 1808 Cedar St
- 2340 Virginia St
- 1515 Oxford St Unit 1D
- 1444 Walnut St
- 1716 Hearst Ave
- 2112 Mckinley Ave Unit D
- 1408 Henry St
- 1425 Martin Luther King jr Way
- 1622 Scenic Ave
- 2451 Le Conte Ave
- 2218 -2222 Grant St
- 2421 Hilgard Ave
- 2477 Virginia St
- 2600 Hilgard Ave
- 2028 Francisco St Unit B
- 2028 Francisco St Unit 2
- 2028 Francisco St Unit A
- 2026 Francisco St Unit 16
- 2026 Francisco St
- 2022 Francisco St
- 2020 Francisco St
- 2035 Francisco St
- 2031 Delaware St
- 2039 Francisco St
- 1752 Shattuck Ave
- 2025 Francisco St
- 2027 Francisco St
- 2029 Delaware St
- 2012 Francisco St
- 2027 Delaware St
- 2023 Delaware St
- 2019 Delaware St
- 2019 Delaware St Unit 2, Berkeley
- 2010 Francisco St
Your Personal Tour Guide
Ask me questions while you tour the home.