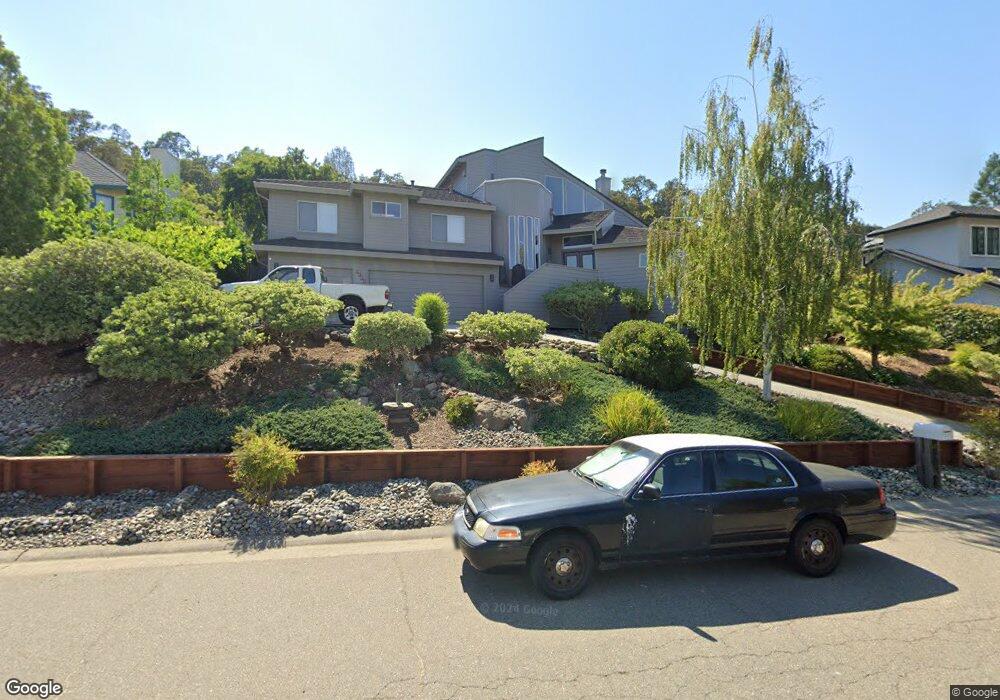
2028 Moonstone Cir El Dorado Hills, CA 95762
Ridgeview Village NeighborhoodEstimated Value: $789,000 - $1,009,247
4
Beds
4
Baths
3,030
Sq Ft
$305/Sq Ft
Est. Value
About This Home
This home is located at 2028 Moonstone Cir, El Dorado Hills, CA 95762 and is currently estimated at $923,812, approximately $304 per square foot. 2028 Moonstone Cir is a home located in El Dorado County with nearby schools including Silva Valley Elementary School, Rolling Hills Middle School, and Oak Ridge High School.
Ownership History
Date
Name
Owned For
Owner Type
Purchase Details
Closed on
Nov 25, 2020
Sold by
Lorange Jon and Wyss Allyson
Bought by
Wyss Allyson M and The Allyson Macon Wyss Revocab
Current Estimated Value
Home Financials for this Owner
Home Financials are based on the most recent Mortgage that was taken out on this home.
Original Mortgage
$308,000
Interest Rate
2.8%
Mortgage Type
New Conventional
Purchase Details
Closed on
Jul 13, 2011
Sold by
Wyss Allyson M
Bought by
Wyss Allyson M and Wyss Allyson Macon
Purchase Details
Closed on
May 5, 2006
Sold by
Wyss Eric Howard and Wyss Allyson Macon
Bought by
Wyss Allyson M
Home Financials for this Owner
Home Financials are based on the most recent Mortgage that was taken out on this home.
Original Mortgage
$411,000
Interest Rate
6.41%
Mortgage Type
Fannie Mae Freddie Mac
Purchase Details
Closed on
Apr 12, 2002
Sold by
Wyss Eric H and Wyss Allyson M
Bought by
Wyss Eric Howard and Wyss Allyson Macon
Create a Home Valuation Report for This Property
The Home Valuation Report is an in-depth analysis detailing your home's value as well as a comparison with similar homes in the area
Home Values in the Area
Average Home Value in this Area
Purchase History
| Date | Buyer | Sale Price | Title Company |
|---|---|---|---|
| Wyss Allyson M | -- | Wfg National Title Ins Co | |
| Lorange Jon | -- | Wfg National Title Ins Co | |
| Wyss Allyson M | -- | None Available | |
| Wyss Allyson M | -- | Fidelity Natl Title Co Of Ca | |
| Wyss Eric Howard | -- | -- |
Source: Public Records
Mortgage History
| Date | Status | Borrower | Loan Amount |
|---|---|---|---|
| Closed | Lorange Jon | $308,000 | |
| Closed | Wyss Allyson M | $411,000 |
Source: Public Records
Tax History Compared to Growth
Tax History
| Year | Tax Paid | Tax Assessment Tax Assessment Total Assessment is a certain percentage of the fair market value that is determined by local assessors to be the total taxable value of land and additions on the property. | Land | Improvement |
|---|---|---|---|---|
| 2025 | $7,402 | $714,961 | $207,406 | $507,555 |
| 2024 | $7,402 | $700,943 | $203,340 | $497,603 |
| 2023 | $7,230 | $687,200 | $199,353 | $487,847 |
| 2022 | $7,150 | $673,727 | $195,445 | $478,282 |
| 2021 | $7,050 | $660,517 | $191,613 | $468,904 |
| 2020 | $6,957 | $653,745 | $189,649 | $464,096 |
| 2019 | $6,847 | $640,928 | $185,931 | $454,997 |
| 2018 | $6,625 | $628,362 | $182,286 | $446,076 |
| 2017 | $6,509 | $616,042 | $178,712 | $437,330 |
| 2016 | $6,417 | $603,963 | $175,208 | $428,755 |
| 2015 | $6,241 | $594,893 | $172,577 | $422,316 |
| 2014 | $6,241 | $583,243 | $169,198 | $414,045 |
Source: Public Records
Map
Nearby Homes
- 3058 Ridgeview Dr
- 3178 Ridgeview Dr
- 3789 Pardee Ct
- 1999 Shelby Cir
- 265 Muse Dr
- 47 Powers Dr
- 2595 Capetanios Dr
- 2581 Capetanios Dr
- 0 Capetanios Dr Unit 222109547
- Plan 2 at Ridgeview
- 3197 Warren Ln
- 3226 Beatty Dr
- 2757 Capetanios Dr
- 3280 Beatty Dr
- 5128 Wild Oak Ln
- 424 Powers Dr
- 3040 Vista Lefonti
- 436 Powers Dr
- 3452 Tah Nee Way
- 2846 Stephens Ln
- 2020 Moonstone Cir
- 3075 Ridgeview Dr
- 3085 Ridgeview Dr
- 2025 Moonstone Cir
- 2033 Moonstone Cir
- 2012 Moonstone Cir
- 2044 Moonstone Cir
- 3063 Ridgeview Dr
- 2017 Moonstone Cir
- 2041 Moonstone Cir
- 3091 Ridgeview Dr
- 3053 Ridgeview Dr
- 1118 Turquoise Way
- 2005 Moonstone Cir
- 1126 Turquoise Way
- 3039 Ridgeview Dr
- 1112 Turquoise Way
- 3031 Ridgeview Dr
- 2049 Moonstone Cir
- 2052 Moonstone Cir