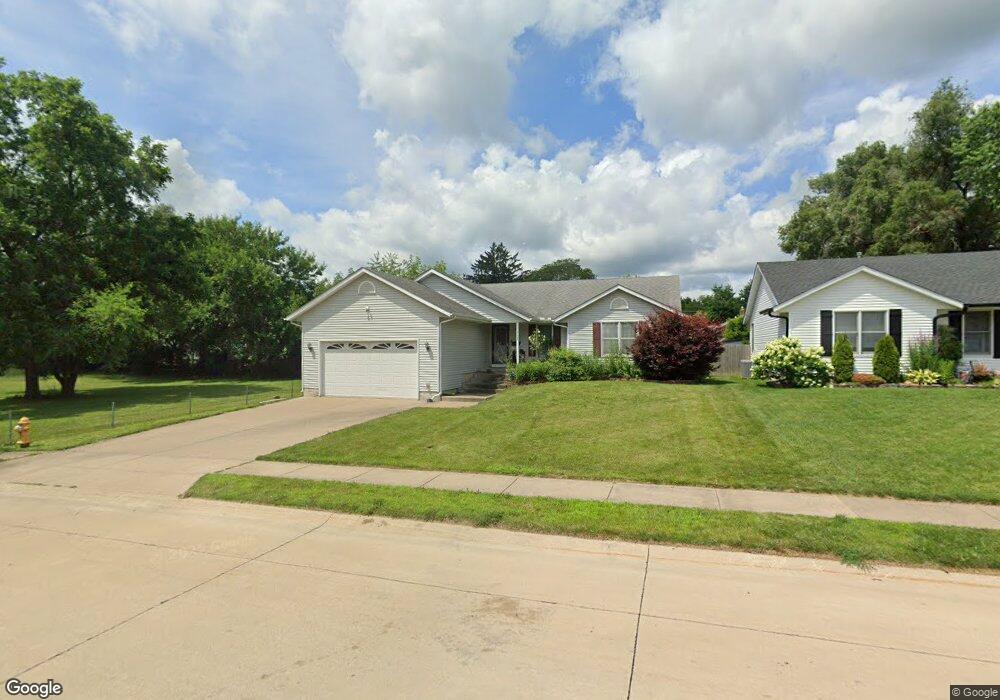
2028 N Gayman Ave Davenport, IA 52804
Northwest Davenport NeighborhoodEstimated Value: $266,000 - $300,000
3
Beds
1
Bath
1,200
Sq Ft
$241/Sq Ft
Est. Value
About This Home
This home is located at 2028 N Gayman Ave, Davenport, IA 52804 and is currently estimated at $288,705, approximately $240 per square foot. 2028 N Gayman Ave is a home located in Scott County with nearby schools including South Christian Elementary School, Christian County Day Treatment Center Alt, and Williams Intermediate School.
Ownership History
Date
Name
Owned For
Owner Type
Purchase Details
Closed on
Aug 15, 2022
Sold by
Langel Jason M and Langel Amanda
Bought by
Koch Ray S
Current Estimated Value
Home Financials for this Owner
Home Financials are based on the most recent Mortgage that was taken out on this home.
Original Mortgage
$236,600
Outstanding Balance
$226,255
Interest Rate
5.54%
Mortgage Type
Balloon
Estimated Equity
$62,450
Purchase Details
Closed on
May 13, 2016
Sold by
Smith Jody
Bought by
Langel Jason M
Create a Home Valuation Report for This Property
The Home Valuation Report is an in-depth analysis detailing your home's value as well as a comparison with similar homes in the area
Home Values in the Area
Average Home Value in this Area
Purchase History
| Date | Buyer | Sale Price | Title Company |
|---|---|---|---|
| Koch Ray S | $278,500 | -- | |
| Langel Jason M | -- | None Available | |
| Langel Jason M | -- | None Available |
Source: Public Records
Mortgage History
| Date | Status | Borrower | Loan Amount |
|---|---|---|---|
| Open | Koch Ray S | $236,600 |
Source: Public Records
Tax History Compared to Growth
Tax History
| Year | Tax Paid | Tax Assessment Tax Assessment Total Assessment is a certain percentage of the fair market value that is determined by local assessors to be the total taxable value of land and additions on the property. | Land | Improvement |
|---|---|---|---|---|
| 2025 | $4,564 | $273,860 | $44,810 | $229,050 |
| 2024 | $4,450 | $265,580 | $44,810 | $220,770 |
| 2023 | $4,566 | $265,580 | $44,810 | $220,770 |
| 2022 | $4,468 | $222,650 | $22,410 | $200,240 |
| 2021 | $4,468 | $217,180 | $22,410 | $194,770 |
| 2020 | $4,250 | $204,440 | $22,410 | $182,030 |
| 2019 | $4,274 | $198,980 | $22,410 | $176,570 |
| 2018 | $4,178 | $198,980 | $22,410 | $176,570 |
| 2017 | $1,107 | $198,980 | $22,410 | $176,570 |
| 2016 | $3,814 | $186,240 | $0 | $0 |
| 2015 | $3,814 | $174,330 | $0 | $0 |
| 2014 | $3,604 | $174,330 | $0 | $0 |
| 2013 | $3,536 | $0 | $0 | $0 |
| 2012 | -- | $161,750 | $20,530 | $141,220 |
Source: Public Records
Map
Nearby Homes
- 0 W Locust St Unit Utah
- 0 W Locust St Unit 23235762
- 0 W Locust St Unit NOC6326699
- 2232 N Nevada Ave
- 1925 N Michigan Ave
- 2334 N Fairmount St
- 3430 W Locust St
- 2025 Emerald Dr
- 2230 Emerald Dr
- Lot 12 Hidden Valley Cir
- 2409 N Michigan Ave
- 2218 Emerald Dr
- 3920 W 13th St
- 4017 W 13th St
- 1310 Calvin St
- 1215 Waverly Rd
- 1215 Calvin St
- 3238 W Colorado St
- 3524 W Garfield St
- 3518 W Garfield St
- 2036 N Gayman Ave
- 2031 N Zenith Ave
- 2017 N Zenith Ave
- 2041 N Zenith Ave
- 2015 N Zenith Ave
- 2027 N Gayman Ave
- 2043 N Zenith Ave
- 2104 N Gayman Ave
- 2041 N Gayman Ave
- 2110 N Gayman Ave
- 2009 N Zenith Ave
- 2107 N Zenith Ave
- 2103 N Gayman Ave
- 2036 N Zenith Ave
- 2020 N Fairmount St
- 2109 N Gayman Ave
- 2118 N Gayman Ave
- 2030 N Fairmount St
- 2001 N Zenith Ave
- 2044 N Zenith Ave