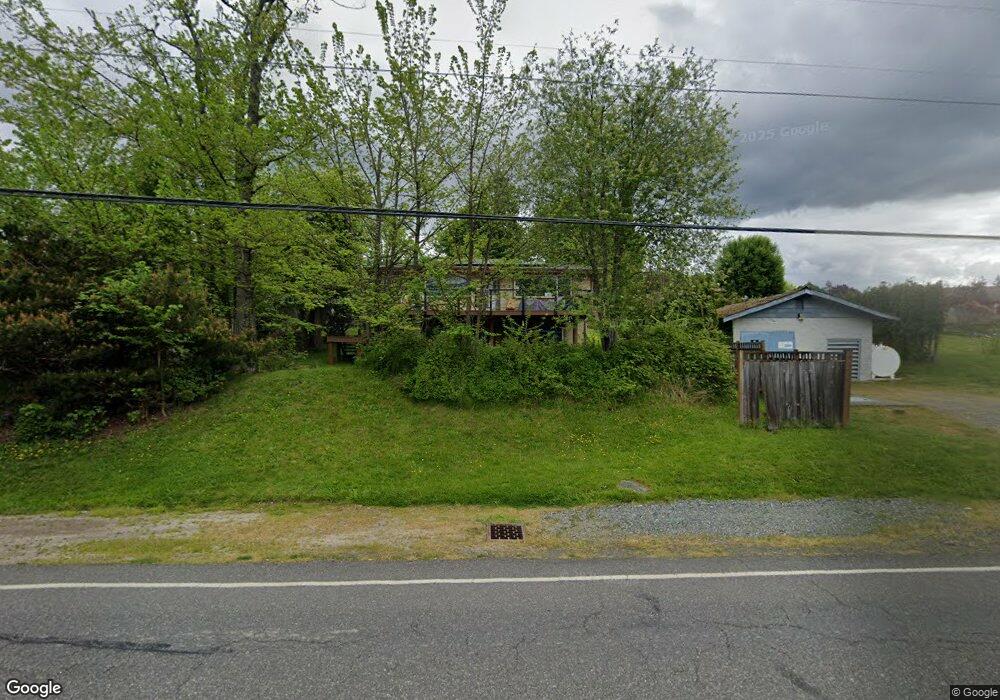
2029 N Shore Dr Bellingham, WA 98226
Silver Beach NeighborhoodEstimated Value: $824,000 - $1,176,000
3
Beds
3
Baths
1,080
Sq Ft
$880/Sq Ft
Est. Value
About This Home
This home is located at 2029 N Shore Dr, Bellingham, WA 98226 and is currently estimated at $950,880, approximately $880 per square foot. 2029 N Shore Dr is a home located in Whatcom County with nearby schools including Silver Beach Elementary School, Whatcom Middle School, and Squalicum High School.
Ownership History
Date
Name
Owned For
Owner Type
Purchase Details
Closed on
Mar 5, 2018
Sold by
Pringle David Daniel and Carrillo Monica
Bought by
Scheib Brittany J and Scheib Lane M
Current Estimated Value
Home Financials for this Owner
Home Financials are based on the most recent Mortgage that was taken out on this home.
Original Mortgage
$351,000
Outstanding Balance
$299,122
Interest Rate
4.15%
Mortgage Type
New Conventional
Estimated Equity
$651,758
Purchase Details
Closed on
Jun 22, 2015
Sold by
Pringle David Daniel
Bought by
Pringle David Daniel and Carrillo Monica
Home Financials for this Owner
Home Financials are based on the most recent Mortgage that was taken out on this home.
Original Mortgage
$188,000
Interest Rate
3.77%
Mortgage Type
New Conventional
Purchase Details
Closed on
Nov 6, 2003
Sold by
Ayling John and Mackie Laurel
Bought by
Pringle David Daniel
Home Financials for this Owner
Home Financials are based on the most recent Mortgage that was taken out on this home.
Original Mortgage
$235,000
Interest Rate
5.94%
Mortgage Type
Purchase Money Mortgage
Purchase Details
Closed on
May 23, 2001
Sold by
Kole John and Kole Kathleen A
Bought by
Ayling John and Mackie Laurel
Create a Home Valuation Report for This Property
The Home Valuation Report is an in-depth analysis detailing your home's value as well as a comparison with similar homes in the area
Home Values in the Area
Average Home Value in this Area
Purchase History
| Date | Buyer | Sale Price | Title Company |
|---|---|---|---|
| Scheib Brittany J | $468,000 | Chicago Title | |
| Pringle David Daniel | -- | Whatcom Land Title | |
| Pringle David Daniel | $315,000 | Chicago Title Insurance | |
| Ayling John | -- | Whatcom Land Title |
Source: Public Records
Mortgage History
| Date | Status | Borrower | Loan Amount |
|---|---|---|---|
| Open | Scheib Brittany J | $351,000 | |
| Previous Owner | Pringle David Daniel | $188,000 | |
| Previous Owner | Pringle David Daniel | $235,000 |
Source: Public Records
Tax History Compared to Growth
Tax History
| Year | Tax Paid | Tax Assessment Tax Assessment Total Assessment is a certain percentage of the fair market value that is determined by local assessors to be the total taxable value of land and additions on the property. | Land | Improvement |
|---|---|---|---|---|
| 2024 | $6,571 | $790,789 | $429,423 | $361,366 |
| 2023 | $6,571 | $825,561 | $448,305 | $377,256 |
| 2022 | $5,559 | $724,177 | $393,250 | $330,927 |
| 2021 | $5,238 | $598,493 | $325,000 | $273,493 |
| 2020 | $4,996 | $517,274 | $282,723 | $234,551 |
| 2019 | $4,403 | $483,412 | $264,355 | $219,057 |
| 2018 | $4,557 | $433,600 | $237,130 | $196,470 |
| 2017 | $3,964 | $383,653 | $209,814 | $173,839 |
| 2016 | $3,625 | $348,816 | $190,938 | $157,878 |
| 2015 | $3,875 | $332,075 | $181,500 | $150,575 |
| 2014 | -- | $343,473 | $187,308 | $156,165 |
| 2013 | -- | $330,193 | $181,500 | $148,693 |
Source: Public Records
Map
Nearby Homes
- 3108 NHN Northshore Rd
- 1715 Eagleridge Dr
- 3401 E 17th Crest
- 1555 Fairview St
- 1558 Fairview St
- 4521 Wall St
- 1538 Fairview St
- 2959 Lake Whatcom Blvd
- 1851 Lakeside Ln
- 1402 Langara Cir
- 2933 Toad Lake Rd
- 4541 Cable St
- 4640 Cable St
- 4522 E Oregon St
- 4414 Alice St
- 4000 Flynn St Unit 50
- 4000 Flynn St Unit 107
- 4431 Alice St
- 4501 E Oregon St
- 4020 Academy St
- 2029 Northshore Dr
- 2369 Northshore Dr
- 2025 Northshore Dr
- 2025 N Shore Dr
- 2023 N Shore Dr
- 2023 Northshore Dr
- 2021 N Shore Dr
- 31 N Shore Rd
- 2112 Northshore Dr
- 2112 Northshore Dr
- 3205 Eagleridge Way
- 2028 Northshore Dr
- 2028 Northshore Dr
- 17 Northshore Rd
- 2019 N Shore Dr
- 3203 Eagleridge Way
- 2114 Northshore Dr
- 3207 Eagleridge Way
- 2017 Northshore Dr