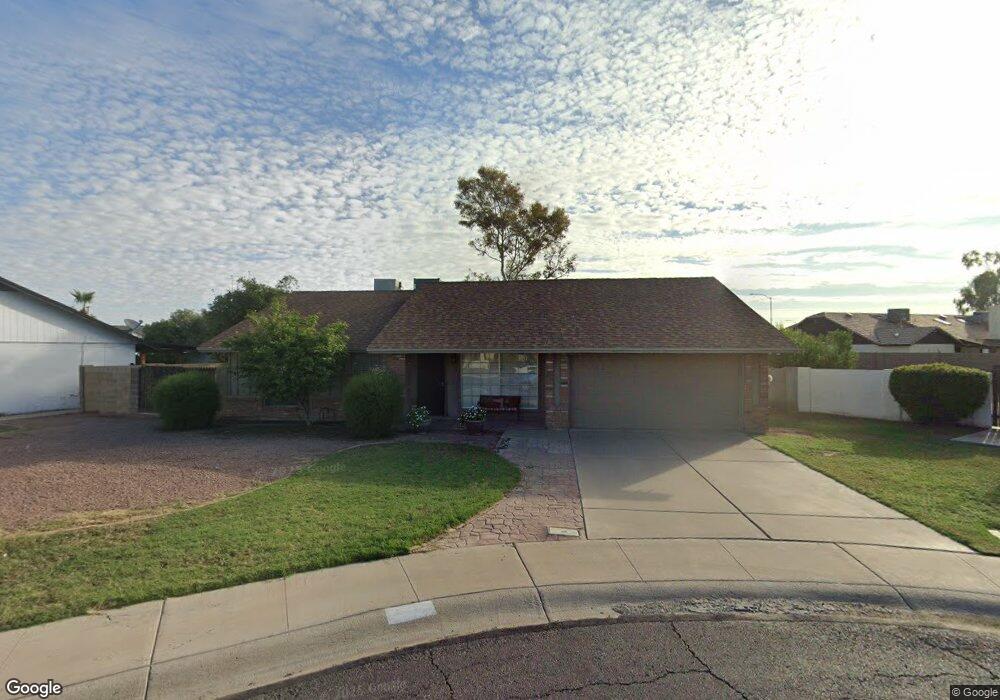
2029 S Saguaro Cir Mesa, AZ 85202
Dobson NeighborhoodEstimated Value: $387,084 - $470,000
--
Bed
2
Baths
1,500
Sq Ft
$282/Sq Ft
Est. Value
About This Home
This home is located at 2029 S Saguaro Cir, Mesa, AZ 85202 and is currently estimated at $423,521, approximately $282 per square foot. 2029 S Saguaro Cir is a home located in Maricopa County with nearby schools including Franklin at Brimhall Elementary School, Washington Elementary School, and Franklin Accelerated Academy Jordan Campus.
Ownership History
Date
Name
Owned For
Owner Type
Purchase Details
Closed on
May 26, 2016
Sold by
Estate Of Todd L Degain
Bought by
Degain Glenn L
Current Estimated Value
Purchase Details
Closed on
Aug 21, 2002
Sold by
Degain Amy E and Clark Amy E
Bought by
Degain Todd L
Home Financials for this Owner
Home Financials are based on the most recent Mortgage that was taken out on this home.
Original Mortgage
$110,400
Interest Rate
8.25%
Purchase Details
Closed on
Jun 9, 1997
Sold by
Johnson Leland A and Johnson Carol A
Bought by
Degain Todd L and Clark Amy E
Home Financials for this Owner
Home Financials are based on the most recent Mortgage that was taken out on this home.
Original Mortgage
$85,200
Interest Rate
7.7%
Mortgage Type
New Conventional
Create a Home Valuation Report for This Property
The Home Valuation Report is an in-depth analysis detailing your home's value as well as a comparison with similar homes in the area
Home Values in the Area
Average Home Value in this Area
Purchase History
| Date | Buyer | Sale Price | Title Company |
|---|---|---|---|
| Degain Glenn L | $100,509 | None Available | |
| Degain Todd L | -- | Century Title Agency | |
| Degain Todd L | $106,500 | Capital Title Agency |
Source: Public Records
Mortgage History
| Date | Status | Borrower | Loan Amount |
|---|---|---|---|
| Previous Owner | Degain Todd L | $110,400 | |
| Previous Owner | Degain Todd L | $85,200 | |
| Closed | Degain Todd L | $27,600 |
Source: Public Records
Tax History Compared to Growth
Tax History
| Year | Tax Paid | Tax Assessment Tax Assessment Total Assessment is a certain percentage of the fair market value that is determined by local assessors to be the total taxable value of land and additions on the property. | Land | Improvement |
|---|---|---|---|---|
| 2025 | $1,363 | $16,416 | -- | -- |
| 2024 | $1,519 | $16,416 | -- | -- |
| 2023 | $1,519 | $34,730 | $6,940 | $27,790 |
| 2022 | $1,486 | $25,880 | $5,170 | $20,710 |
| 2021 | $1,527 | $23,980 | $4,790 | $19,190 |
| 2020 | $1,506 | $22,220 | $4,440 | $17,780 |
| 2019 | $1,396 | $20,310 | $4,060 | $16,250 |
| 2018 | $1,333 | $18,700 | $3,740 | $14,960 |
| 2017 | $1,291 | $17,570 | $3,510 | $14,060 |
| 2016 | $1,267 | $17,210 | $3,440 | $13,770 |
| 2015 | $1,196 | $15,660 | $3,130 | $12,530 |
Source: Public Records
Map
Nearby Homes
- 2019 S Henkel Cir
- 2061 S Rogers
- 2040 S Longmore Unit 9
- 2040 S Longmore Unit 33
- 1331 W Baseline Rd Unit 167
- 1331 W Baseline Rd Unit 251
- 1331 W Baseline Rd Unit 148
- 1331 W Baseline Rd Unit 171
- 1331 W Baseline Rd Unit 348
- 1331 W Baseline Rd Unit 272
- 1331 W Baseline Rd Unit 253
- 1331 W Baseline Rd Unit 102
- 1331 W Baseline Rd Unit 153
- 1542 W Impala Ave
- 1255 W Baseline Rd Unit B139
- 1231 W Baseline Rd
- 1358 W Lobo Ave
- 1338 W Lobo Ave
- 1652 S Saguaro
- 2406 S Mulberry
- 2021 S Saguaro Cir Unit 18
- 2039 S Saguaro Cir
- 2026 S Ash Cir
- 2018 S Ash Cir
- 2030 S Saguaro Cir
- 2038 S Ash Cir Unit 18
- 2042 S Saguaro Cir
- 2022 S Saguaro Cir Unit 18
- 1546 W Knowles Ave
- 1550 W Knowles Ave
- 1542 W Knowles Ave
- 1556 W Lindner Ave
- 1552 W Lindner Ave
- 1554 W Knowles Ave
- 1560 W Lindner Ave
- 2041 S Longmore Unit 18
- 1538 W Knowles Ave
- 2033 S Longmore
- 1548 W Lindner Ave
- 2049 S Longmore