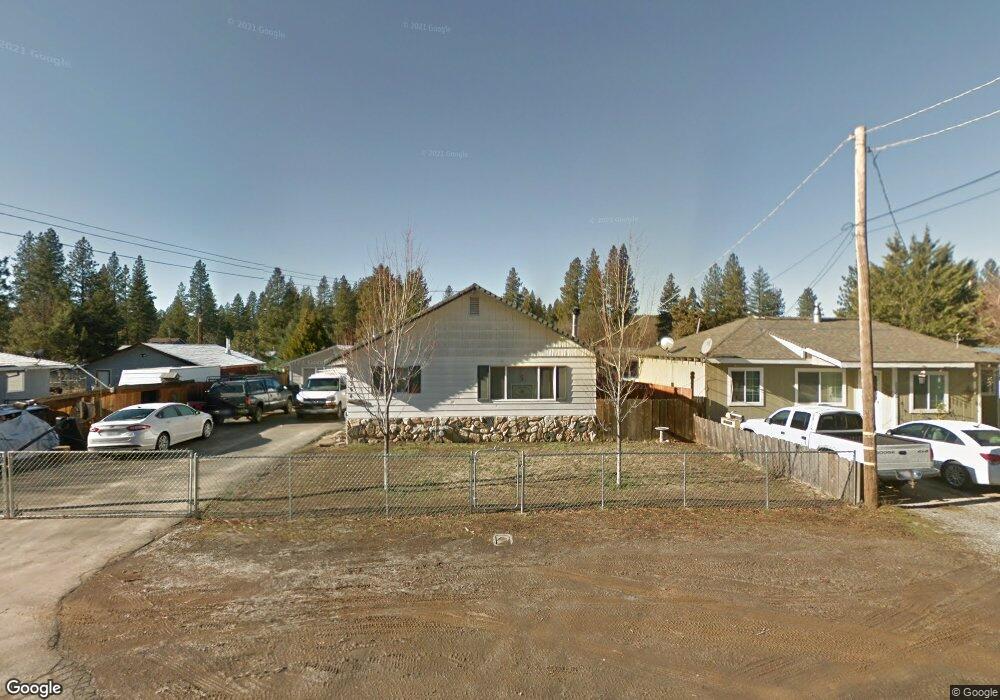
20294 Grogan St Burney, CA 96013
Estimated Value: $235,452 - $246,000
3
Beds
1
Bath
1,338
Sq Ft
$180/Sq Ft
Est. Value
About This Home
This home is located at 20294 Grogan St, Burney, CA 96013 and is currently estimated at $240,613, approximately $179 per square foot. 20294 Grogan St is a home located in Shasta County with nearby schools including Burney Elementary School and Burney Junior/Senior High School.
Ownership History
Date
Name
Owned For
Owner Type
Purchase Details
Closed on
Aug 8, 2006
Sold by
Spotten Steven
Bought by
Covert Tim and Covert Erin
Current Estimated Value
Home Financials for this Owner
Home Financials are based on the most recent Mortgage that was taken out on this home.
Original Mortgage
$143,200
Outstanding Balance
$85,694
Interest Rate
6.7%
Mortgage Type
Unknown
Estimated Equity
$154,919
Purchase Details
Closed on
Jul 9, 2003
Sold by
Spotten Shawna
Bought by
Spotten Steven
Home Financials for this Owner
Home Financials are based on the most recent Mortgage that was taken out on this home.
Original Mortgage
$64,750
Interest Rate
5.29%
Mortgage Type
Unknown
Purchase Details
Closed on
Aug 26, 1997
Sold by
Dva Richards Chris A
Bought by
Spotten Steven and Spotten Shawna
Purchase Details
Closed on
Jan 16, 1997
Sold by
Va
Bought by
Richards Chris A
Create a Home Valuation Report for This Property
The Home Valuation Report is an in-depth analysis detailing your home's value as well as a comparison with similar homes in the area
Home Values in the Area
Average Home Value in this Area
Purchase History
We collect this data history from publicly available records. To have your information removed, we recommend requesting removal directly through your county’s website.
| Date | Buyer | Sale Price | Title Company |
|---|---|---|---|
| Covert Tim | $179,000 | First American Title Co | |
| Spotten Steven | -- | First American Title Co | |
| Spotten Steven | -- | Placer Title Company | |
| Spotten Steven | $9,500 | Placer Title Company | |
| Richards Chris A | -- | Placer Title Company |
Source: Public Records
Mortgage History
We collect this data history from publicly available records. To have your information removed, we recommend requesting removal directly through your county’s website.
| Date | Status | Borrower | Loan Amount |
|---|---|---|---|
| Open | Covert Tim | $143,200 | |
| Previous Owner | Spotten Steven | $64,750 |
Source: Public Records
Tax History
| Year | Tax Paid | Tax Assessment Tax Assessment Total Assessment is a certain percentage of the fair market value that is determined by local assessors to be the total taxable value of land and additions on the property. | Land | Improvement |
|---|---|---|---|---|
| 2025 | $2,460 | $239,803 | $46,885 | $192,918 |
| 2024 | $2,425 | $235,102 | $45,966 | $189,136 |
| 2023 | $2,425 | $230,493 | $45,065 | $185,428 |
| 2022 | $2,354 | $225,975 | $44,182 | $181,793 |
| 2021 | $1,533 | $150,000 | $25,000 | $125,000 |
| 2020 | $1,544 | $150,000 | $25,000 | $125,000 |
| 2019 | $1,832 | $180,217 | $25,000 | $155,217 |
| 2018 | $1,941 | $179,880 | $25,000 | $154,880 |
| 2017 | $1,657 | $159,540 | $20,000 | $139,540 |
| 2016 | $1,217 | $120,210 | $20,000 | $100,210 |
| 2015 | $1,111 | $110,880 | $20,000 | $90,880 |
| 2014 | $930 | $93,220 | $20,000 | $73,220 |
Source: Public Records
Map
Nearby Homes
- 37176 Washburn Ave
- 37269 Birch Ave
- 20344 Hudson St
- 37217 Park Ave
- 37353 & 57 Ponderosa Ave
- 000 Park Ave
- 37061 Park Ave
- 20169 Marquette St
- 0 Serpentine Ln
- 20194 Sugar Pine St
- 20476 Marquette St
- 20227 Sugar Pine St
- 37153 Siskiyou St
- 37151 Serpentine Ln
- 37023 Park Ave
- 20274 Arrowood St
- 0 Superior Ave
- 010 Kirby Ct
- 007 Kirby Ct
- 3 Kirby Ct
- 20300 Grogan St
- 20286 Grogan St
- 37219 Bue Way
- 37207 Bue Way
- 37195 Bue Way
- 20274 Grogan St
- 37196 Sandy Ln
- 37193 Bue Way
- 20289 Grogan St
- 20283 Grogan St
- 20297 Grogan St
- 20268 Grogan St
- 37216 Bue Way
- 37208 Bue Way
- 20305 Grogan St
- 20275 Grogan St
- 37194 Bue Way
- 20322 Grogan St
- 37171 Bue Way
- 20267 Grogan St
Your Personal Tour Guide
Ask me questions while you tour the home.