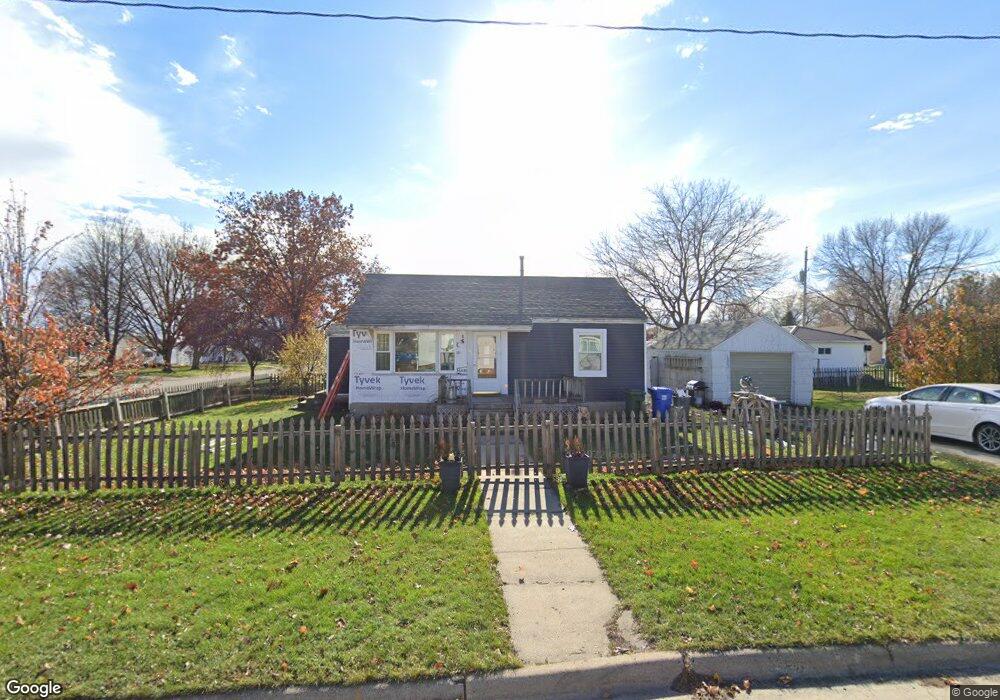
203 6th St Allison, IA 50602
Estimated Value: $64,000 - $113,000
2
Beds
1
Bath
768
Sq Ft
$103/Sq Ft
Est. Value
About This Home
This home is located at 203 6th St, Allison, IA 50602 and is currently estimated at $79,166, approximately $103 per square foot. 203 6th St is a home located in Butler County with nearby schools including North Butler Elementary and North Butler Junior/Senior High School.
Ownership History
Date
Name
Owned For
Owner Type
Purchase Details
Closed on
Feb 20, 2025
Sold by
Sheriff Butler County Court
Bought by
Farmers State Bank
Current Estimated Value
Purchase Details
Closed on
Jun 1, 2017
Sold by
Rogers Ryan L and Rogers Jessica L
Bought by
Johnson Cindy L
Purchase Details
Closed on
Dec 16, 2011
Sold by
Bruns James L
Bought by
Rogers Ryan L and Rogers Jessica Lj
Home Financials for this Owner
Home Financials are based on the most recent Mortgage that was taken out on this home.
Original Mortgage
$32,163
Interest Rate
4.37%
Mortgage Type
FHA
Create a Home Valuation Report for This Property
The Home Valuation Report is an in-depth analysis detailing your home's value as well as a comparison with similar homes in the area
Home Values in the Area
Average Home Value in this Area
Purchase History
| Date | Buyer | Sale Price | Title Company |
|---|---|---|---|
| Farmers State Bank | $95,060 | None Listed On Document | |
| Johnson Cindy L | $41,500 | None Available | |
| Rogers Ryan L | $33,000 | None Available |
Source: Public Records
Mortgage History
| Date | Status | Borrower | Loan Amount |
|---|---|---|---|
| Previous Owner | Rogers Ryan L | $32,163 |
Source: Public Records
Tax History Compared to Growth
Tax History
| Year | Tax Paid | Tax Assessment Tax Assessment Total Assessment is a certain percentage of the fair market value that is determined by local assessors to be the total taxable value of land and additions on the property. | Land | Improvement |
|---|---|---|---|---|
| 2024 | $922 | $52,930 | $9,140 | $43,790 |
| 2023 | $954 | $52,930 | $9,140 | $43,790 |
| 2022 | $908 | $49,220 | $9,140 | $40,080 |
| 2021 | $894 | $49,220 | $9,140 | $40,080 |
| 2020 | $894 | $44,440 | $9,140 | $35,300 |
| 2019 | $834 | $41,370 | $0 | $0 |
| 2018 | $890 | $41,370 | $0 | $0 |
| 2017 | $890 | $41,370 | $0 | $0 |
| 2016 | $684 | $39,480 | $0 | $0 |
| 2015 | $684 | $39,480 | $0 | $0 |
| 2014 | $676 | $39,480 | $0 | $0 |
Source: Public Records
Map
Nearby Homes