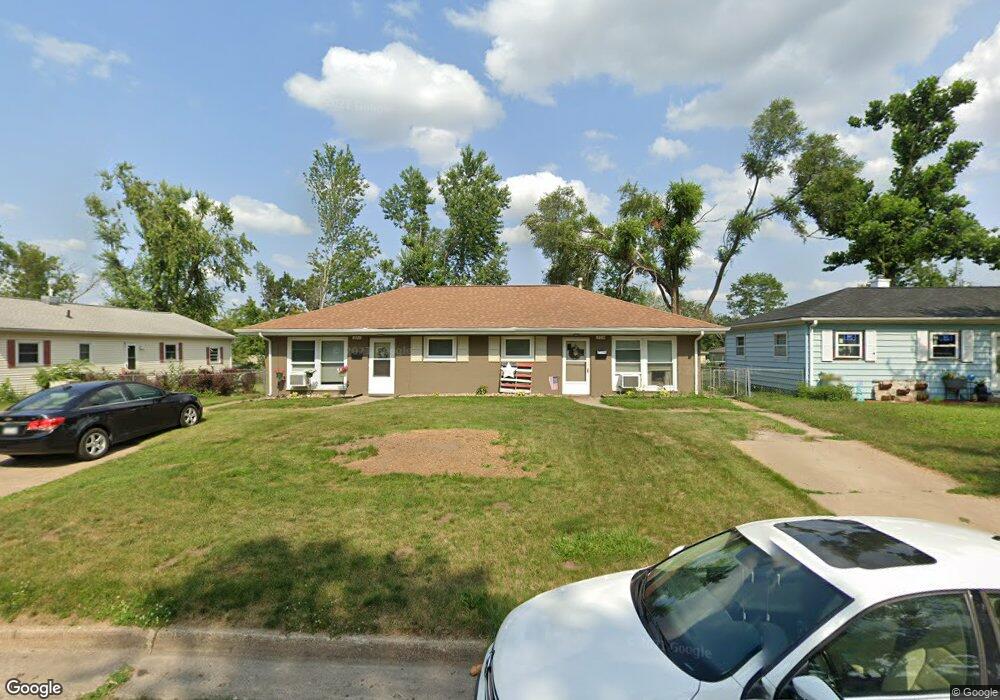
203 8th Ave Hiawatha, IA 52233
Estimated Value: $156,212 - $236,000
4
Beds
2
Baths
1,456
Sq Ft
$135/Sq Ft
Est. Value
About This Home
This home is located at 203 8th Ave, Hiawatha, IA 52233 and is currently estimated at $196,303, approximately $134 per square foot. 203 8th Ave is a home located in Linn County with nearby schools including Hiawatha Elementary School, Harding Middle School, and John F. Kennedy High School.
Ownership History
Date
Name
Owned For
Owner Type
Purchase Details
Closed on
Jul 22, 2023
Sold by
Wright Robert C
Bought by
Living Trust and Hemphill
Current Estimated Value
Purchase Details
Closed on
Mar 14, 2022
Sold by
Gilbert Jr Gary D
Bought by
G G Properties Lc
Purchase Details
Closed on
Dec 27, 2021
Sold by
Simpson Breona B and Simpson Eric
Bought by
Tlusty Gregory A and Tlusty Kelly M
Purchase Details
Closed on
May 20, 2021
Sold by
Kentana Llc
Bought by
Bastian Ryan R and Bastian Tracy L
Home Financials for this Owner
Home Financials are based on the most recent Mortgage that was taken out on this home.
Original Mortgage
$119,900
Interest Rate
2.3%
Mortgage Type
New Conventional
Purchase Details
Closed on
Aug 3, 2017
Sold by
Wrob Llc
Bought by
Kentana Llc
Purchase Details
Closed on
Jul 14, 2017
Sold by
Terry Timothy F and Terry Family Revocable Trust
Bought by
Wrob Llc
Create a Home Valuation Report for This Property
The Home Valuation Report is an in-depth analysis detailing your home's value as well as a comparison with similar homes in the area
Home Values in the Area
Average Home Value in this Area
Purchase History
| Date | Buyer | Sale Price | Title Company |
|---|---|---|---|
| Living Trust | -- | None Listed On Document | |
| Living Trust | -- | None Listed On Document | |
| G G Properties Lc | -- | None Listed On Document | |
| Tlusty Gregory A | $175,000 | None Listed On Document | |
| Bastian Ryan R | $160,000 | None Available | |
| Kentana Llc | $107,000 | None Available | |
| Wrob Llc | $115,000 | None Available |
Source: Public Records
Mortgage History
| Date | Status | Borrower | Loan Amount |
|---|---|---|---|
| Previous Owner | Bastian Ryan R | $119,900 |
Source: Public Records
Tax History Compared to Growth
Tax History
| Year | Tax Paid | Tax Assessment Tax Assessment Total Assessment is a certain percentage of the fair market value that is determined by local assessors to be the total taxable value of land and additions on the property. | Land | Improvement |
|---|---|---|---|---|
| 2025 | $2,088 | $144,900 | $19,800 | $125,100 |
| 2024 | $1,946 | $127,000 | $19,800 | $107,200 |
| 2023 | $1,946 | $127,000 | $19,800 | $107,200 |
| 2022 | $1,922 | $96,000 | $19,800 | $76,200 |
| 2021 | $2,130 | $96,000 | $19,800 | $76,200 |
| 2020 | $2,130 | $99,400 | $19,800 | $79,600 |
| 2019 | $1,994 | $93,500 | $19,800 | $73,700 |
| 2018 | $1,958 | $93,500 | $19,800 | $73,700 |
| 2017 | $1,924 | $87,900 | $19,800 | $68,100 |
| 2016 | $1,776 | $83,200 | $19,800 | $63,400 |
| 2015 | $1,780 | $83,200 | $19,800 | $63,400 |
| 2014 | $1,780 | $83,200 | $19,800 | $63,400 |
| 2013 | $1,734 | $83,200 | $19,800 | $63,400 |
Source: Public Records
Map
Nearby Homes
- 306 10th Ave
- 1026 Eisenhower Rd
- 5455 Blairs Ferry Rd NE
- 3 N Center Point Rd
- 1 N Center Point Rd
- 40 11th Ave
- 2131 Blairs Ferry Rd NE
- 1213 Raney St
- 1213 Bowler St
- 1284 Rainbow Blvd
- 109 E Willman St
- 1364 Cress Pkwy
- 250 Cimarron Dr NE Unit 309
- 114 Northwood Dr
- 402 Cimarron Dr Unit 402
- 4735 Westchester Dr NE Unit C
- 250 Cimarron Dr Unit 311
- 250 Cimarron Dr Unit 122
- 4630 Westchester Dr NE
- 4725 Westchester Dr NE Unit C