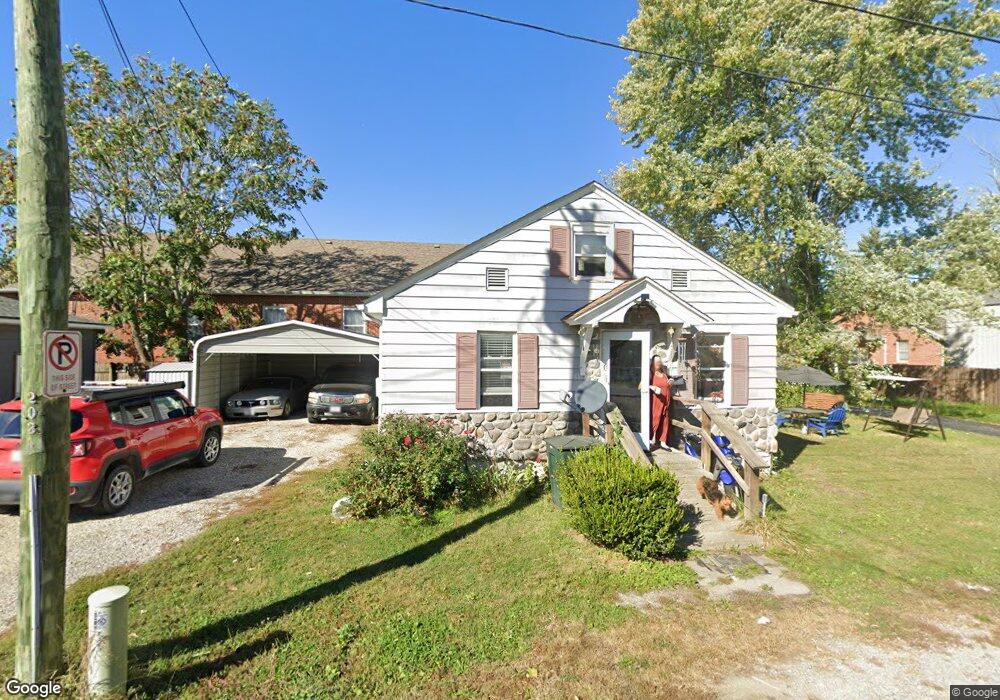
203 Addison St Fulton, MO 65251
Estimated Value: $96,000 - $137,866
2
Beds
1
Bath
700
Sq Ft
$175/Sq Ft
Est. Value
About This Home
This home is located at 203 Addison St, Fulton, MO 65251 and is currently estimated at $122,467, approximately $174 per square foot. 203 Addison St is a home located in Callaway County with nearby schools including Fulton Senior High School, Kingdom Christian Academy, and St. Peter Catholic School.
Ownership History
Date
Name
Owned For
Owner Type
Purchase Details
Closed on
Aug 10, 2009
Sold by
Polacak August
Bought by
Duncan Robert D and Duncan Anna M
Current Estimated Value
Home Financials for this Owner
Home Financials are based on the most recent Mortgage that was taken out on this home.
Original Mortgage
$40,000
Interest Rate
5.44%
Mortgage Type
Future Advance Clause Open End Mortgage
Create a Home Valuation Report for This Property
The Home Valuation Report is an in-depth analysis detailing your home's value as well as a comparison with similar homes in the area
Home Values in the Area
Average Home Value in this Area
Purchase History
| Date | Buyer | Sale Price | Title Company |
|---|---|---|---|
| Duncan Robert D | -- | None Available |
Source: Public Records
Mortgage History
| Date | Status | Borrower | Loan Amount |
|---|---|---|---|
| Closed | Duncan Robert D | $40,000 |
Source: Public Records
Tax History Compared to Growth
Tax History
| Year | Tax Paid | Tax Assessment Tax Assessment Total Assessment is a certain percentage of the fair market value that is determined by local assessors to be the total taxable value of land and additions on the property. | Land | Improvement |
|---|---|---|---|---|
| 2024 | $661 | $10,693 | $0 | $0 |
| 2023 | $661 | $10,218 | $0 | $0 |
| 2022 | $629 | $10,218 | $984 | $9,234 |
| 2021 | $628 | $10,218 | $984 | $9,234 |
| 2020 | $637 | $10,218 | $984 | $9,234 |
| 2019 | $616 | $10,218 | $984 | $9,234 |
| 2018 | $637 | $10,218 | $984 | $9,234 |
| 2017 | $567 | $10,218 | $984 | $9,234 |
| 2016 | $457 | $7,900 | $0 | $0 |
| 2015 | $447 | $7,900 | $0 | $0 |
| 2014 | -- | $7,670 | $0 | $0 |
Source: Public Records
Map
Nearby Homes