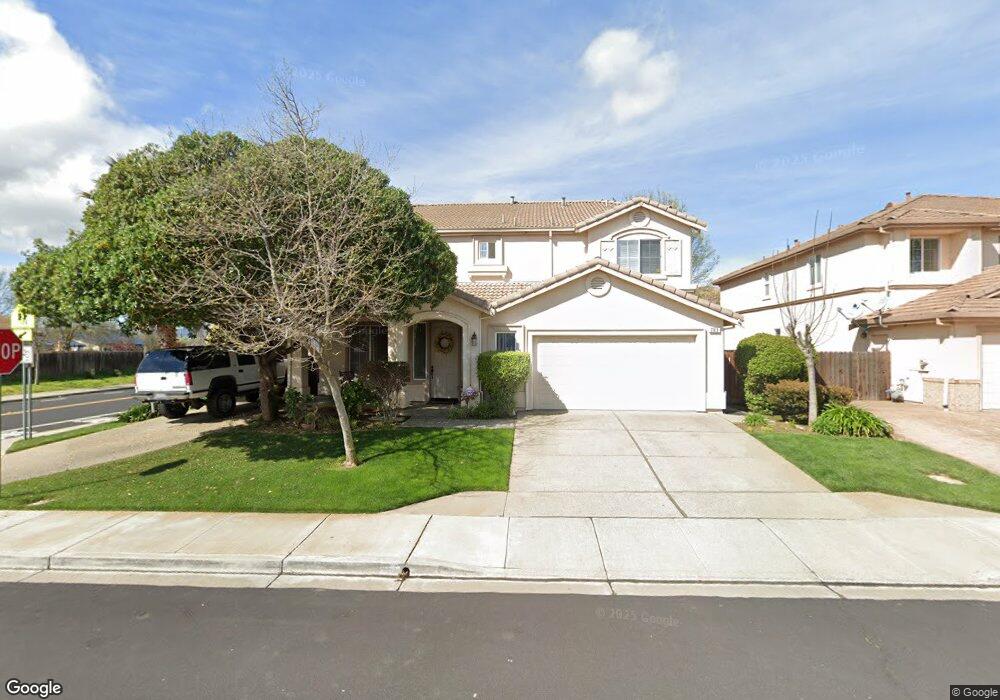
203 Amesbury Ct Discovery Bay, CA 94505
Estimated Value: $815,000 - $854,000
5
Beds
3
Baths
2,965
Sq Ft
$280/Sq Ft
Est. Value
About This Home
This home is located at 203 Amesbury Ct, Discovery Bay, CA 94505 and is currently estimated at $829,365, approximately $279 per square foot. 203 Amesbury Ct is a home located in Contra Costa County with nearby schools including Timber Point Elementary School, Excelsior Middle School, and Liberty High School.
Ownership History
Date
Name
Owned For
Owner Type
Purchase Details
Closed on
Oct 9, 2017
Sold by
Kilsiewicz Thomas
Bought by
Klisiewicz Thomas
Current Estimated Value
Home Financials for this Owner
Home Financials are based on the most recent Mortgage that was taken out on this home.
Interest Rate
3.85%
Purchase Details
Closed on
Jul 23, 2002
Sold by
Robinson Eric A and Robinson Stacy M
Bought by
Klisiewicz Thomas and Klisiewicz Jacquelyn
Home Financials for this Owner
Home Financials are based on the most recent Mortgage that was taken out on this home.
Original Mortgage
$319,950
Interest Rate
5%
Mortgage Type
Purchase Money Mortgage
Purchase Details
Closed on
Aug 24, 2001
Sold by
Hofmann Construction Co
Bought by
Robinson Eric A and Robinson Stacy M
Home Financials for this Owner
Home Financials are based on the most recent Mortgage that was taken out on this home.
Original Mortgage
$304,100
Interest Rate
7.09%
Mortgage Type
Purchase Money Mortgage
Create a Home Valuation Report for This Property
The Home Valuation Report is an in-depth analysis detailing your home's value as well as a comparison with similar homes in the area
Home Values in the Area
Average Home Value in this Area
Purchase History
| Date | Buyer | Sale Price | Title Company |
|---|---|---|---|
| Klisiewicz Thomas | -- | -- | |
| Klisiewicz Thomas | $400,000 | Commonwealth Land Title | |
| Robinson Eric A | $380,500 | First American Title Guarant |
Source: Public Records
Mortgage History
| Date | Status | Borrower | Loan Amount |
|---|---|---|---|
| Closed | Klisiewicz Thomas | -- | |
| Previous Owner | Klisiewicz Thomas | $319,950 | |
| Previous Owner | Robinson Eric A | $304,100 | |
| Closed | Klisiewicz Thomas | $40,000 | |
| Closed | Klisiewicz Thomas | $0 |
Source: Public Records
Tax History Compared to Growth
Tax History
| Year | Tax Paid | Tax Assessment Tax Assessment Total Assessment is a certain percentage of the fair market value that is determined by local assessors to be the total taxable value of land and additions on the property. | Land | Improvement |
|---|---|---|---|---|
| 2025 | $8,143 | $579,310 | $195,514 | $383,796 |
| 2024 | $8,017 | $567,952 | $191,681 | $376,271 |
| 2023 | $8,017 | $556,817 | $187,923 | $368,894 |
| 2022 | $7,885 | $545,900 | $184,239 | $361,661 |
| 2021 | $7,701 | $535,197 | $180,627 | $354,570 |
| 2019 | $7,572 | $519,324 | $175,270 | $344,054 |
| 2018 | $7,280 | $509,142 | $171,834 | $337,308 |
| 2017 | $7,130 | $499,160 | $168,465 | $330,695 |
| 2016 | $6,476 | $463,500 | $156,430 | $307,070 |
| 2015 | $6,590 | $482,024 | $162,682 | $319,342 |
| 2014 | $5,195 | $355,500 | $119,981 | $235,519 |
Source: Public Records
Map
Nearby Homes
- 117 Cardinal Ln
- 2233 Hampshire Dr
- 115 Tennyson Ct
- 531 Half Moon Ct
- 1688 Wilde Dr
- 716 Seminole Ct
- 834 Blue Mesa Ct
- 324 Coronado Ct
- Plan 6 at Seagrass - Estates
- Plan 2 at Seagrass - Residences
- Plan 3 at Seagrass - Residences
- Plan 4 at Seagrass - Estates
- Plan 1 at Seagrass - Residences
- Plan 5 at Seagrass - Estates
- 1058 Bradbury Dr
- 3638 Otter Brook Loop
- 1145 Bradbury Dr
- 1154 Bradbury Dr
- 3627 Otter Brook Loop
- 3645 Otter Brook Loop
- 108 Cardinal Ln
- 305 Fareham Ct
- 219 Amesbury Ct
- 202 Amesbury Ct
- 116 Cardinal Ln
- 210 Amesbury Ct
- 313 Fareham Ct
- 227 Amesbury Ct
- 304 Fareham Ct
- 218 Amesbury Ct
- 124 Cardinal Ln
- 312 Fareham Ct
- 405 Emerson Ct Unit 110
- 101 Cardinal Ln
- 226 Amesbury Ct
- 321 Fareham Ct
- 109 Cardinal Ln
- 235 Amesbury Ct
- 411 Emerson Ct