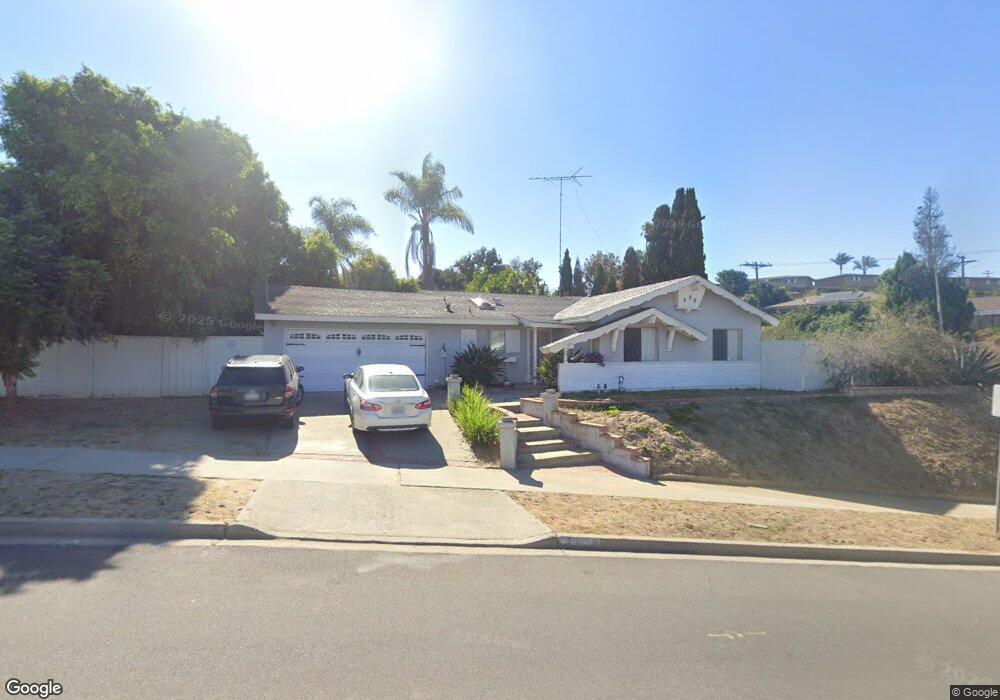
203 Carey Rd Oceanside, CA 92054
Loma Alta NeighborhoodEstimated Value: $817,090 - $1,078,000
3
Beds
2
Baths
1,176
Sq Ft
$808/Sq Ft
Est. Value
About This Home
This home is located at 203 Carey Rd, Oceanside, CA 92054 and is currently estimated at $949,773, approximately $807 per square foot. 203 Carey Rd is a home located in San Diego County with nearby schools including Mission Elementary School, Oceanside High School, and Oceanside Adventist Elementary School.
Ownership History
Date
Name
Owned For
Owner Type
Purchase Details
Closed on
Aug 5, 2014
Sold by
Gardner John T
Bought by
Bussey Gardner Mary Jane
Current Estimated Value
Purchase Details
Closed on
Jun 3, 1994
Sold by
Rodriguez Richard M and Coletta Rodriguez Teena Marie
Bought by
Gardner John T and Gardner Mary Jane Bussey
Home Financials for this Owner
Home Financials are based on the most recent Mortgage that was taken out on this home.
Original Mortgage
$108,000
Interest Rate
8.57%
Purchase Details
Closed on
Nov 25, 1987
Create a Home Valuation Report for This Property
The Home Valuation Report is an in-depth analysis detailing your home's value as well as a comparison with similar homes in the area
Home Values in the Area
Average Home Value in this Area
Purchase History
| Date | Buyer | Sale Price | Title Company |
|---|---|---|---|
| Bussey Gardner Mary Jane | -- | None Available | |
| Gardner John T | $126,000 | Old Republic Title Company | |
| -- | $89,000 | -- |
Source: Public Records
Mortgage History
| Date | Status | Borrower | Loan Amount |
|---|---|---|---|
| Previous Owner | Gardner John T | $108,000 |
Source: Public Records
Tax History
| Year | Tax Paid | Tax Assessment Tax Assessment Total Assessment is a certain percentage of the fair market value that is determined by local assessors to be the total taxable value of land and additions on the property. | Land | Improvement |
|---|---|---|---|---|
| 2025 | $2,292 | $211,608 | $105,804 | $105,804 |
| 2024 | $2,292 | $207,460 | $103,730 | $103,730 |
| 2023 | $2,220 | $203,394 | $101,697 | $101,697 |
| 2022 | $2,185 | $199,406 | $99,703 | $99,703 |
| 2021 | $2,192 | $195,498 | $97,749 | $97,749 |
| 2020 | $2,125 | $193,494 | $96,747 | $96,747 |
| 2019 | $2,063 | $189,700 | $94,850 | $94,850 |
| 2018 | $2,039 | $185,982 | $92,991 | $92,991 |
| 2017 | $2,000 | $182,336 | $91,168 | $91,168 |
| 2016 | $1,934 | $178,762 | $89,381 | $89,381 |
| 2015 | $1,877 | $176,078 | $88,039 | $88,039 |
| 2014 | $1,805 | $172,630 | $86,315 | $86,315 |
Source: Public Records
Map
Nearby Homes
- 168 Carey Rd
- 2309 Saratoga St
- 506 Canyon Dr Unit 6
- 0 Amick St Unit 146-100-23-00, 21, 1
- 2721 Lomita St
- 2861 Turnbull St
- 415 Stoney Point Way Unit 106
- 230 Hoover St
- 420 Stoney Point Way Unit 113
- 430 Stoney Point Way Unit 124
- 2904 E Barnwell St
- 1432 Buena St
- 2843 Todd St
- 2937 E Barnwell St
- 1328 Buena St
- 503 505 N Nevada St
- 722 &718 N Freeman St
- 1330 Bush St
- 509 Rockledge St
- 426 Grant St
- 2170 El Monte Dr
- 0 Canyon Dr
- 2166 El Monte Dr
- 2202 El Monte Dr
- 2207 El Monte Dr
- 2125 Hilldale St
- 2121 Hilldale St
- 2129 Hilldale St
- 2167 El Monte Dr
- 2162 El Monte Dr
- 2117 Hilldale St
- 2211 El Monte Dr
- 2206 El Monte Dr
- 2113 Hilldale St
- 2231 Hilldale St
- 2237 Hilldale St
- 2109 Hilldale St
- 2210 El Monte Dr
- 2155 El Monte Dr
- 2219 El Monte Dr
Your Personal Tour Guide
Ask me questions while you tour the home.