
Last list price
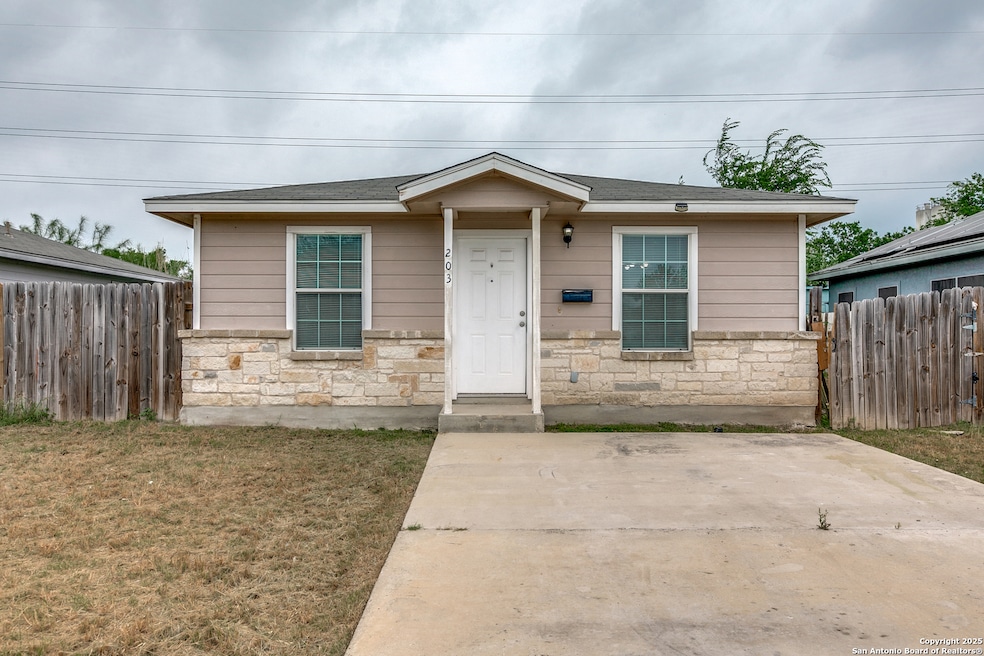
203 Carranza St San Antonio, TX 78225
Quintana Neighborhood
3
Beds
2
Baths
1,025
Sq Ft
4,095
Sq Ft Lot
Highlights
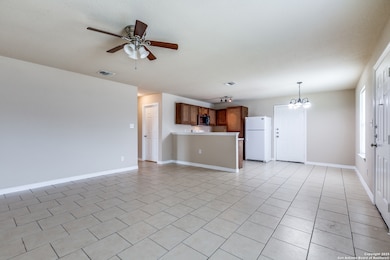
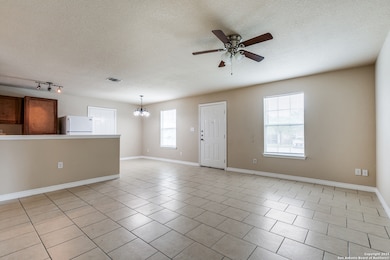
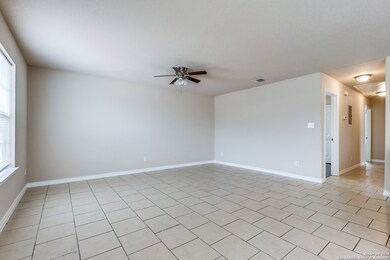
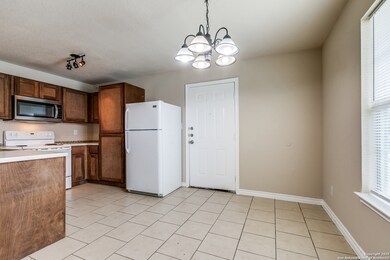
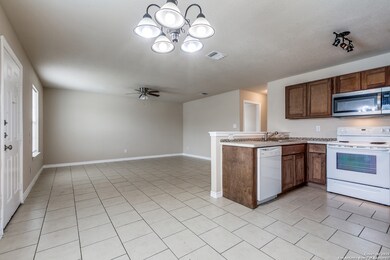
- Ceramic Tile Flooring
- Central Heating and Cooling System
- Ceiling Fan
About This Home
As of July 2025This house was built in 2017 and all of the other houses on Carranza Street are quite new which gives this small quiet cul-de-sac neighborhood a great feel as well as low future maintenance costs and the vinyl plank flooring in the bedrooms looks great. The house is conveniently located near Lackland Air Force Base, Alto College and downtown. Priced more than $18K below tax appraised value! Prequalified offers only please.
Last Buyer's Agent
Micheal Thetchampa
Realty One Group Emerald
Home Details
Home Type
- Single Family
Est. Annual Taxes
- $4,899
Year Built
- Built in 2017
Lot Details
- 4,095 Sq Ft Lot
Home Design
- Slab Foundation
- Composition Roof
- Masonry
Interior Spaces
- 1,025 Sq Ft Home
- Property has 1 Level
- Ceiling Fan
- Window Treatments
- Fire and Smoke Detector
- Washer Hookup
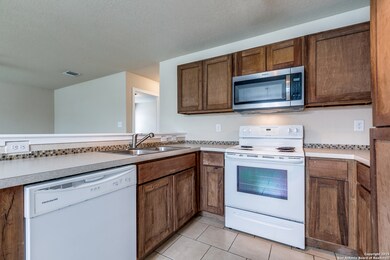
Kitchen
- Stove
- Microwave
- Dishwasher
- Disposal
Flooring
- Ceramic Tile
- Vinyl
Bedrooms and Bathrooms
- 3 Bedrooms
- 2 Full Bathrooms
Schools
- Graebner Elementary School
- Lowell Middle School
- Burbank High School
Utilities
- Central Heating and Cooling System
- Electric Water Heater
Community Details
- Built by Grupo Del Torro
- Carranza Subdivision
Listing and Financial Details
- Legal Lot and Block 8 / 2
- Assessor Parcel Number 092930020080
Similar Homes in San Antonio, TX
Create a Home Valuation Report for This Property
The Home Valuation Report is an in-depth analysis detailing your home's value as well as a comparison with similar homes in the area
Home Values in the Area
Average Home Value in this Area
Mortgage History
| Date | Status | Loan Amount | Loan Type |
|---|---|---|---|
| Closed | $343,700 | Commercial |
Source: Public Records
Property History
| Date | Event | Price | Change | Sq Ft Price |
|---|---|---|---|---|
| 07/14/2025 07/14/25 | Sold | -- | -- | -- |
| 07/08/2025 07/08/25 | Off Market | -- | -- | -- |
| 06/25/2025 06/25/25 | Pending | -- | -- | -- |
| 06/06/2025 06/06/25 | For Sale | $159,900 | +9893.8% | $156 / Sq Ft |
| 06/03/2025 06/03/25 | Off Market | -- | -- | -- |
| 05/16/2025 05/16/25 | For Rent | $1,600 | 0.0% | -- |
| 04/18/2025 04/18/25 | Price Changed | $159,900 | -1.3% | $156 / Sq Ft |
| 03/21/2025 03/21/25 | Price Changed | $162,000 | -1.8% | $158 / Sq Ft |
| 02/09/2025 02/09/25 | Price Changed | $165,000 | -1.2% | $161 / Sq Ft |
| 12/04/2024 12/04/24 | Price Changed | $167,000 | -1.2% | $163 / Sq Ft |
| 11/05/2024 11/05/24 | Price Changed | $169,000 | -1.7% | $165 / Sq Ft |
| 10/28/2024 10/28/24 | Price Changed | $172,000 | -1.1% | $168 / Sq Ft |
| 10/17/2024 10/17/24 | Price Changed | $174,000 | -1.7% | $170 / Sq Ft |
| 10/08/2024 10/08/24 | Price Changed | $177,000 | -1.7% | $173 / Sq Ft |
| 10/02/2024 10/02/24 | Price Changed | $180,000 | -1.1% | $176 / Sq Ft |
| 09/18/2024 09/18/24 | Price Changed | $182,000 | -1.1% | $178 / Sq Ft |
| 09/10/2024 09/10/24 | Price Changed | $184,000 | -1.6% | $180 / Sq Ft |
| 08/22/2024 08/22/24 | Price Changed | $187,000 | -1.6% | $182 / Sq Ft |
| 08/09/2024 08/09/24 | Price Changed | $190,000 | -2.6% | $185 / Sq Ft |
| 08/03/2024 08/03/24 | Price Changed | $195,000 | -2.0% | $190 / Sq Ft |
| 07/18/2024 07/18/24 | For Sale | $199,000 | 0.0% | $194 / Sq Ft |
| 06/01/2023 06/01/23 | Rented | $1,375 | 0.0% | -- |
| 05/23/2023 05/23/23 | Price Changed | $1,375 | -3.5% | $1 / Sq Ft |
| 05/15/2023 05/15/23 | For Rent | $1,425 | +10.0% | -- |
| 06/14/2022 06/14/22 | Off Market | $1,295 | -- | -- |
| 03/18/2022 03/18/22 | Rented | $1,295 | -7.2% | -- |
| 02/16/2022 02/16/22 | Under Contract | -- | -- | -- |
| 02/10/2022 02/10/22 | For Rent | $1,395 | -- | -- |
Source: San Antonio Board of REALTORS®
Tax History Compared to Growth
Tax History
| Year | Tax Paid | Tax Assessment Tax Assessment Total Assessment is a certain percentage of the fair market value that is determined by local assessors to be the total taxable value of land and additions on the property. | Land | Improvement |
|---|---|---|---|---|
| 2023 | $4,795 | $183,800 | $30,260 | $153,540 |
| 2022 | $4,623 | $170,630 | $22,940 | $147,690 |
| 2021 | $3,620 | $129,560 | $10,320 | $119,240 |
| 2020 | $3,530 | $124,550 | $10,320 | $114,230 |
| 2019 | $3,461 | $120,760 | $10,320 | $110,440 |
| 2018 | $3,267 | $115,120 | $10,320 | $104,800 |
| 2017 | $146 | $5,160 | $5,160 | $0 |
| 2016 | $146 | $5,160 | $5,160 | $0 |
| 2015 | -- | $5,160 | $5,160 | $0 |
| 2014 | -- | $3,400 | $0 | $0 |
Source: Public Records
Agents Affiliated with this Home
-
Lance Adams
L
Seller's Agent in 2025
Lance Adams
THE ADAMS GROUP LLC
(512) 777-1560
2 in this area
4 Total Sales
-
M
Buyer's Agent in 2025
Micheal Thetchampa
Realty One Group Emerald
-
A
Seller's Agent in 2023
Albert Arguelles
LPT Realty, LLC
-
Stephany Caravantes Sanchez
S
Seller's Agent in 2022
Stephany Caravantes Sanchez
Marshall Reddick Real Estate
(210) 589-9579
35 Total Sales
-
Pedro Sierra
P
Buyer's Agent in 2022
Pedro Sierra
Coldwell Banker D'Ann Harper
(210) 535-2091
16 Total Sales
Map
Source: San Antonio Board of REALTORS®
MLS Number: 1793964
APN: 09293-002-0080
Disclaimer: Certain information contained herein is derived from information provided by parties other than Homes.com. All information provided is deemed reliable, but is not guaranteed to be accurate and should be independently verified.
![]() IDX information is provided exclusively for personal, non-commercial use, and may not be used for any purpose other than to identify prospective properties consumers may be interested in purchasing.
IDX information is provided exclusively for personal, non-commercial use, and may not be used for any purpose other than to identify prospective properties consumers may be interested in purchasing.
Information is deemed reliable but not guaranteed.
Nearby Homes
- 1137 Jennings Ave
- 751 Royston Ave
- 113 Ross Ave
- 115 Elmo Ave
- 2220 Calle Estrella
- 1605 W Winnipeg Ave
- 234 Southway Dr
- 2807 Roselawn Rd
- 446 Royston Ave
- 219 W Greenway Ave
- 426 Royston Ave
- 254 W Greenway Ave
- 126 Hosack Ave
- 250 W Emerson Ave
- 1419 W Malone Ave
- 323 Pletz Dr
- 1560 Brighton
- 326 Royston Ave
- 859 Thompson Place
- 1246 Thompson Place