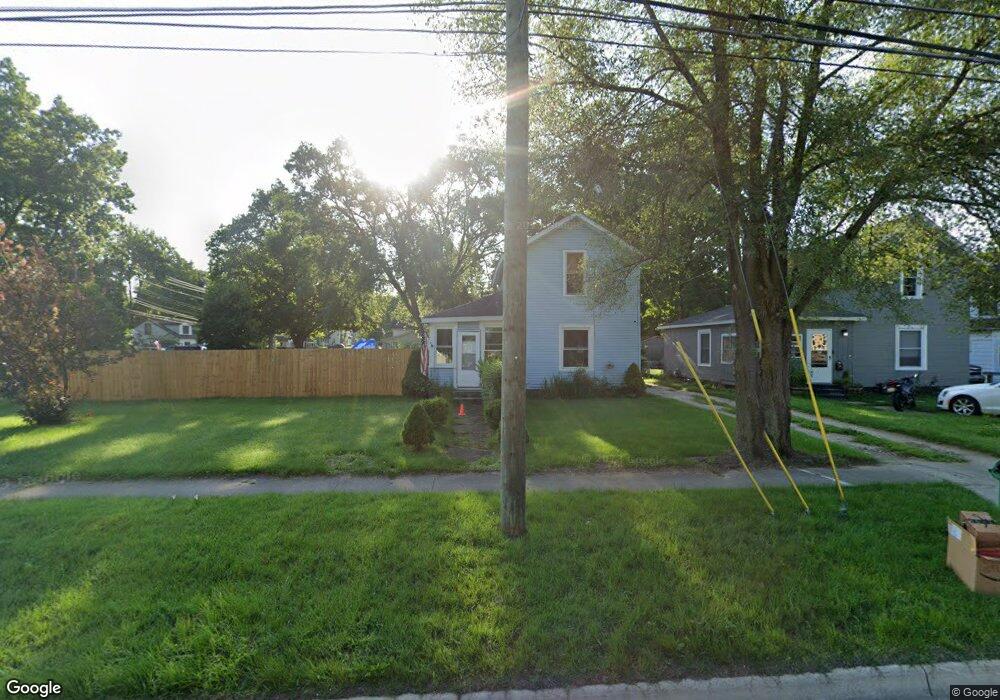
203 Cass Ave Dowagiac, MI 49047
Estimated Value: $129,000 - $170,000
2
Beds
1
Bath
1,092
Sq Ft
$135/Sq Ft
Est. Value
About This Home
This home is located at 203 Cass Ave, Dowagiac, MI 49047 and is currently estimated at $147,157, approximately $134 per square foot. 203 Cass Ave is a home located in Cass County with nearby schools including Justus Gage Elementary School, Dowagiac Middle School, and Union High School.
Ownership History
Date
Name
Owned For
Owner Type
Purchase Details
Closed on
Oct 17, 2017
Sold by
Baker Thomas W and Baker Diane M
Bought by
Earl Mullins Robert S
Current Estimated Value
Purchase Details
Closed on
Oct 21, 2015
Sold by
Secretary Of Housing & Urban Development
Bought by
Baker Thomas W and Baker Diane M
Purchase Details
Closed on
Mar 18, 2014
Sold by
1St Source Bank
Bought by
Secretary Of Housing & Urban Development
Purchase Details
Closed on
Mar 5, 2014
Sold by
Dorsey Joseph S and 1St Source
Bought by
1St Source Bank
Purchase Details
Closed on
Nov 13, 2009
Sold by
The Donald Gray Jr Revocable Trust
Bought by
Dorsey Joseph S
Home Financials for this Owner
Home Financials are based on the most recent Mortgage that was taken out on this home.
Original Mortgage
$43,203
Interest Rate
4.9%
Mortgage Type
FHA
Purchase Details
Closed on
Aug 21, 2008
Sold by
Gray Donald
Bought by
Gray Donald and Donald Gray Jr Revocable Trust
Create a Home Valuation Report for This Property
The Home Valuation Report is an in-depth analysis detailing your home's value as well as a comparison with similar homes in the area
Home Values in the Area
Average Home Value in this Area
Purchase History
| Date | Buyer | Sale Price | Title Company |
|---|---|---|---|
| Earl Mullins Robert S | $10,000 | First Addition Title | |
| Baker Thomas W | $10,000 | Chicago Title | |
| Secretary Of Housing & Urban Development | -- | Attorney | |
| 1St Source Bank | $46,485 | None Available | |
| Dorsey Joseph S | $44,000 | Chicago Title | |
| Gray Donald | -- | None Available |
Source: Public Records
Mortgage History
| Date | Status | Borrower | Loan Amount |
|---|---|---|---|
| Previous Owner | Dorsey Joseph S | $43,203 |
Source: Public Records
Tax History Compared to Growth
Tax History
| Year | Tax Paid | Tax Assessment Tax Assessment Total Assessment is a certain percentage of the fair market value that is determined by local assessors to be the total taxable value of land and additions on the property. | Land | Improvement |
|---|---|---|---|---|
| 2025 | $1,336 | $47,200 | $47,200 | $0 |
| 2024 | $617 | $36,200 | $36,200 | $0 |
| 2023 | $567 | $30,200 | $0 | $0 |
| 2022 | $540 | $26,300 | $0 | $0 |
| 2021 | $1,113 | $23,000 | $0 | $0 |
| 2020 | $519 | $21,700 | $0 | $0 |
| 2019 | $1,083 | $21,300 | $0 | $0 |
| 2018 | $495 | $17,400 | $0 | $0 |
| 2017 | $442 | $16,700 | $0 | $0 |
| 2016 | $435 | $15,400 | $0 | $0 |
| 2015 | -- | $15,900 | $0 | $0 |
| 2011 | -- | $18,100 | $0 | $0 |
Source: Public Records
Map
Nearby Homes
- 204 E High St
- 530 S Front St
- 208 Halstead St
- 307 New York Ave
- 106 Lagrange St
- 402 Michigan Ave
- 102 S Mill St
- 400 S Lowe St
- 100 Dogwood Cir
- 105 Lester Ave
- 107 Lester Ave
- 425 Chestnut St
- 423 E Division St
- 309 N Front St
- 409 Spruce St
- 210 McOmber St
- 307 E Telegraph St
- 403 Orchard St
- 310 W Telegraph St
- 608 W High St