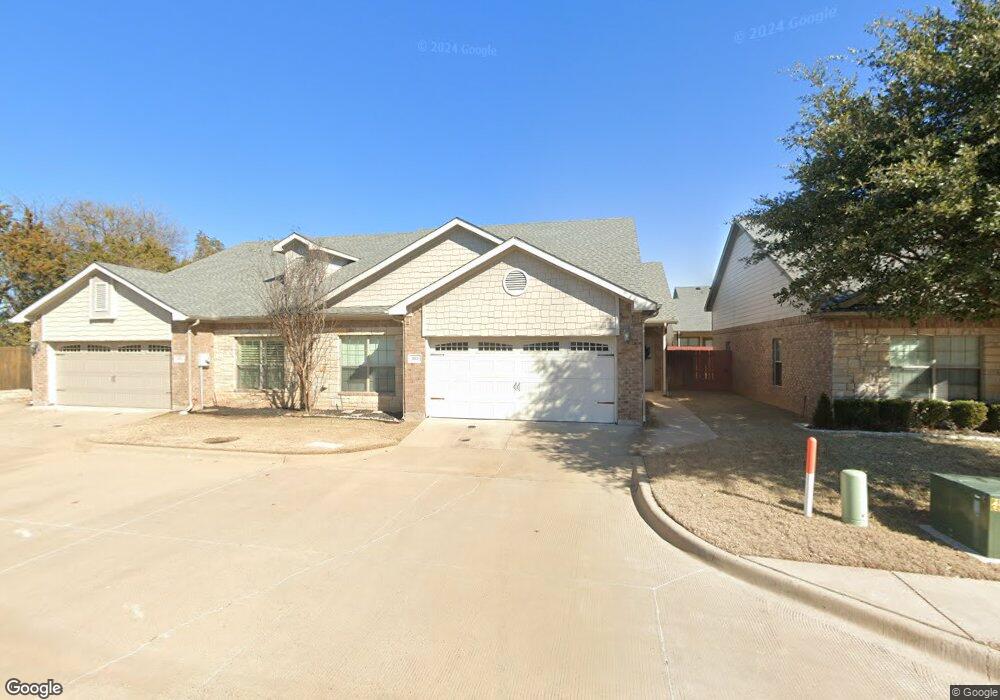
203 Chelsea Ct Granbury, TX 76049
Estimated Value: $270,685 - $326,000
3
Beds
2
Baths
1,417
Sq Ft
$202/Sq Ft
Est. Value
About This Home
This home is located at 203 Chelsea Ct, Granbury, TX 76049 and is currently estimated at $286,421, approximately $202 per square foot. 203 Chelsea Ct is a home located in Hood County with nearby schools including Oak Woods School, Acton Middle School, and Granbury High School.
Ownership History
Date
Name
Owned For
Owner Type
Purchase Details
Closed on
Feb 21, 2020
Sold by
Jomc Properties Inc
Bought by
Johnson Terri J
Current Estimated Value
Home Financials for this Owner
Home Financials are based on the most recent Mortgage that was taken out on this home.
Original Mortgage
$196,175
Outstanding Balance
$173,699
Interest Rate
3.6%
Mortgage Type
New Conventional
Estimated Equity
$112,722
Purchase Details
Closed on
Jan 28, 2015
Sold by
The Secretary Of Veterans Affairs
Bought by
Jomc Properties Inc
Purchase Details
Closed on
Dec 10, 2014
Sold by
Guild Mortgage Company
Bought by
Secretary Of Veterans Affairs
Purchase Details
Closed on
Nov 13, 2014
Sold by
Therrien Alexander J and Therrien Lois J
Bought by
Guild Mortgage Company
Purchase Details
Closed on
Mar 11, 2011
Sold by
Granbury Davis Road Development Ltd
Bought by
Therrien Alexander J and Therrien Lois J
Home Financials for this Owner
Home Financials are based on the most recent Mortgage that was taken out on this home.
Original Mortgage
$157,016
Interest Rate
4.78%
Mortgage Type
VA
Create a Home Valuation Report for This Property
The Home Valuation Report is an in-depth analysis detailing your home's value as well as a comparison with similar homes in the area
Home Values in the Area
Average Home Value in this Area
Purchase History
| Date | Buyer | Sale Price | Title Company |
|---|---|---|---|
| Johnson Terri J | -- | Town Square Title Company | |
| Jomc Properties Inc | $142,500 | Central Texas Title | |
| Secretary Of Veterans Affairs | -- | None Available | |
| Guild Mortgage Company | $131,828 | None Available | |
| Therrien Alexander J | -- | Central Texas Title |
Source: Public Records
Mortgage History
| Date | Status | Borrower | Loan Amount |
|---|---|---|---|
| Open | Johnson Terri J | $196,175 | |
| Previous Owner | Therrien Alexander J | $157,016 |
Source: Public Records
Tax History Compared to Growth
Tax History
| Year | Tax Paid | Tax Assessment Tax Assessment Total Assessment is a certain percentage of the fair market value that is determined by local assessors to be the total taxable value of land and additions on the property. | Land | Improvement |
|---|---|---|---|---|
| 2025 | $2,037 | $274,490 | $35,000 | $239,490 |
| 2024 | $2,161 | $284,284 | $35,000 | $272,230 |
| 2023 | $4,140 | $294,550 | $35,000 | $259,550 |
| 2022 | $3,330 | $249,650 | $25,000 | $224,650 |
| 2021 | $4,125 | $213,590 | $25,000 | $188,590 |
| 2020 | $4,005 | $205,110 | $25,000 | $180,110 |
| 2019 | $3,382 | $167,020 | $25,000 | $142,020 |
| 2018 | $3,218 | $158,910 | $25,000 | $133,910 |
| 2017 | $3,002 | $145,060 | $25,000 | $120,060 |
| 2016 | $2,949 | $142,500 | $25,000 | $117,500 |
| 2015 | $2,952 | $142,500 | $25,000 | $117,500 |
| 2014 | $2,952 | $143,700 | $25,000 | $118,700 |
Source: Public Records
Map
Nearby Homes
- 2231 Cobblestone Ct
- 210 Davis Rd
- 502 Shady Grove Dr
- 704 Shady Grove Ct
- 157 Business Blvd
- 3224 W Weems Ct
- 2009 Rock Dr
- 1066 Ranch Vista Rd
- 615 Whisperview Cir
- 1055 Ranch Vista Rd
- 420 Crestline Dr
- 513 Crestline Dr
- 1042 Ranch Rd
- 1054 Ranch Rd
- 1048 Ranch Rd
- 2023 Cordova Cir
- 805 Branding Iron Trail
- 3617 Fm-4 Tbd
- Residence 3 Plan at The Residences at Cardinal Woods
- Residence 5 Plan at The Residences at Cardinal Woods
- 201 Chelsea Ct
- 205 Chelsea Ct
- 207 Chelsea Ct
- 2229 Cobblestone Ct
- 2233 Cobblestone Ct
- 2227 Cobblestone Ct
- 200 Chelsea Ct
- 204 Chelsea Ct
- 202 Chelsea Ct
- 206 Chelsea Ct
- 2210 Cobblestone Ct
- 2208 Cobblestone Ct
- 2206 Cobblestone Ct
- 2212 Cobblestone Ct
- 2234 Cobblestone Ct
- 2204 Cobblestone Ct
- 2202 Cobblestone Ct
- 2214 Cobblestone Ct
- 2232 Cobblestone Ct
- 2230 Cobblestone Ct