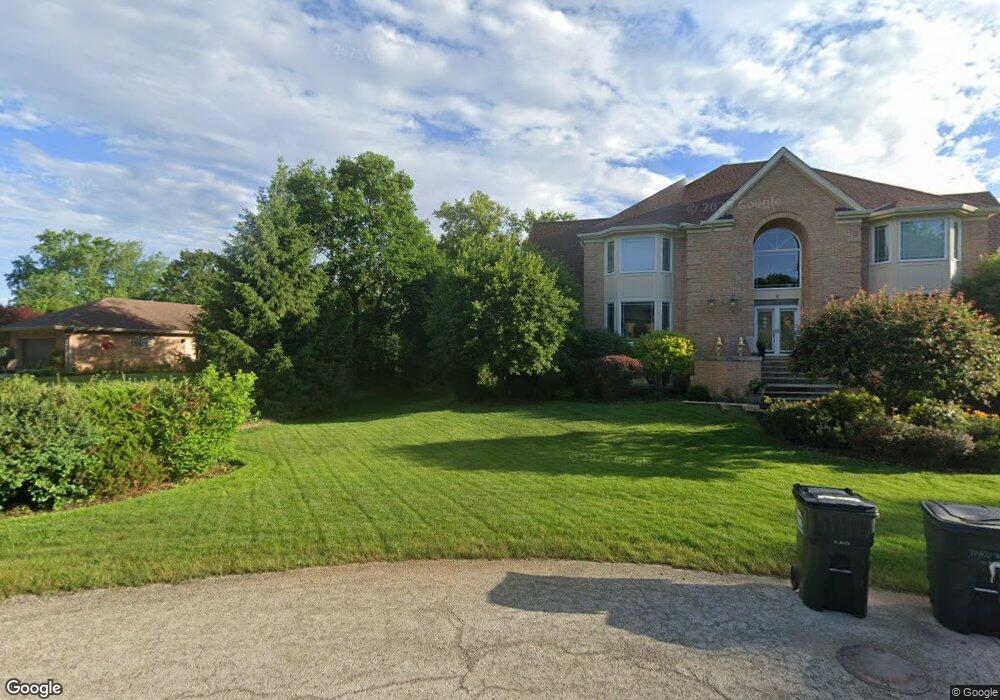
203 E Kenilworth Ave Prospect Heights, IL 60070
Estimated Value: $556,000 - $681,000
3
Beds
2
Baths
1,752
Sq Ft
$358/Sq Ft
Est. Value
About This Home
This home is located at 203 E Kenilworth Ave, Prospect Heights, IL 60070 and is currently estimated at $627,573, approximately $358 per square foot. 203 E Kenilworth Ave is a home located in Cook County with nearby schools including Dwight D Eisenhower Elementary School, Anne Sullivan Elementary School, and Betsy Ross Elementary School.
Ownership History
Date
Name
Owned For
Owner Type
Purchase Details
Closed on
Oct 7, 2024
Sold by
Pizzimenti Anthony P and Pizzimenti Emily L
Bought by
Imburgia Joseph T and Dey Jennifer L
Current Estimated Value
Purchase Details
Closed on
Mar 4, 2021
Sold by
Bulbuc Johny and Bulbuc Nicole Alexander
Bought by
Pizzimenti Anthony P and Pizzimenti Emily L
Home Financials for this Owner
Home Financials are based on the most recent Mortgage that was taken out on this home.
Original Mortgage
$375,200
Interest Rate
2.62%
Mortgage Type
New Conventional
Purchase Details
Closed on
Mar 8, 2019
Sold by
Starr Jerome and Starr Shery
Bought by
Bulbuc Johny
Home Financials for this Owner
Home Financials are based on the most recent Mortgage that was taken out on this home.
Original Mortgage
$243,750
Interest Rate
4.87%
Mortgage Type
New Conventional
Purchase Details
Closed on
Mar 21, 2016
Sold by
Declar Shipley Arthur G
Bought by
Starr Jerome
Purchase Details
Closed on
Sep 26, 1998
Sold by
Shipley Arthur G and Shipley Melba
Bought by
Declar Shipley Melba Jane and Melba Jane Shipley 1998 Declaration Tr
Create a Home Valuation Report for This Property
The Home Valuation Report is an in-depth analysis detailing your home's value as well as a comparison with similar homes in the area
Home Values in the Area
Average Home Value in this Area
Purchase History
| Date | Buyer | Sale Price | Title Company |
|---|---|---|---|
| Imburgia Joseph T | $600,000 | Attorneys Title | |
| Pizzimenti Anthony P | $469,000 | Baird & Warner Ttl Svcs Inc | |
| Bulbuc Johny | $325,000 | Attorney | |
| Starr Jerome | $235,000 | Attorney | |
| Declar Shipley Melba Jane | -- | -- |
Source: Public Records
Mortgage History
| Date | Status | Borrower | Loan Amount |
|---|---|---|---|
| Previous Owner | Pizzimenti Anthony P | $375,200 | |
| Previous Owner | Bulbuc Johny | $243,750 |
Source: Public Records
Tax History Compared to Growth
Tax History
| Year | Tax Paid | Tax Assessment Tax Assessment Total Assessment is a certain percentage of the fair market value that is determined by local assessors to be the total taxable value of land and additions on the property. | Land | Improvement |
|---|---|---|---|---|
| 2024 | $11,120 | $37,000 | $9,151 | $27,849 |
| 2023 | $10,426 | $37,000 | $9,151 | $27,849 |
| 2022 | $10,426 | $37,000 | $9,151 | $27,849 |
| 2021 | $7,183 | $25,238 | $8,007 | $17,231 |
| 2020 | $7,029 | $25,238 | $8,007 | $17,231 |
| 2019 | $8,002 | $28,231 | $8,007 | $20,224 |
| 2018 | $8,817 | $28,522 | $6,863 | $21,659 |
| 2017 | $9,582 | $31,348 | $6,863 | $24,485 |
| 2016 | $8,919 | $31,348 | $6,863 | $24,485 |
| 2015 | $8,393 | $26,714 | $5,719 | $20,995 |
| 2014 | $8,305 | $26,714 | $5,719 | $20,995 |
| 2013 | $6,734 | $26,714 | $5,719 | $20,995 |
Source: Public Records
Map
Nearby Homes
- 505 N Maple St
- 13 W Kenilworth Ave
- 11 W Palatine Rd
- 1525 Sander Ct Unit 103
- 1575 Sandpebble Dr Unit 226
- 1550 Sandpebble Dr Unit 209
- 1500 Sandstone Dr Unit 307
- 1450 Sandpebble Dr Unit 333
- 1450 Sandpebble Dr Unit 227
- 1430 Sandstone Dr Unit 202
- 1425 Sandpebble Dr Unit 227
- 1425 Sandpebble Dr Unit 340
- 1376 Longacre Ln Unit 113
- 161 Lucerne Ct Unit 111713
- 150 Lucerne Ct Unit 51713
- 1321 Longacre Ln Unit 45
- 1655 Geneva Dr Unit 43714
- 206 E Camp Mcdonald Rd
- 307 Anne Ct
- 1201 Pleasant Run Dr Unit 312
- 205 E Kenilworth Ave
- 105 E Kenilworth Ave
- 103 E Kenilworth Ave
- 107 E Kenilworth Ave
- 102 E Kenilworth Ave
- 509 N Maple St
- 406 Hill Ct
- 507 N Maple St
- 104 E Kenilworth Ave
- 100 E Kenilworth Ave
- 404 Hill Ct
- 103 Creek Ct
- 109 E Kenilworth Ave
- 408 Hill Ct
- 101 Creek Ct
- 106 E Kenilworth Ave
- 503 N Maple St
- 106 Creek Ct
- 201 E Kenilworth Ave
- 402 Hill Ct