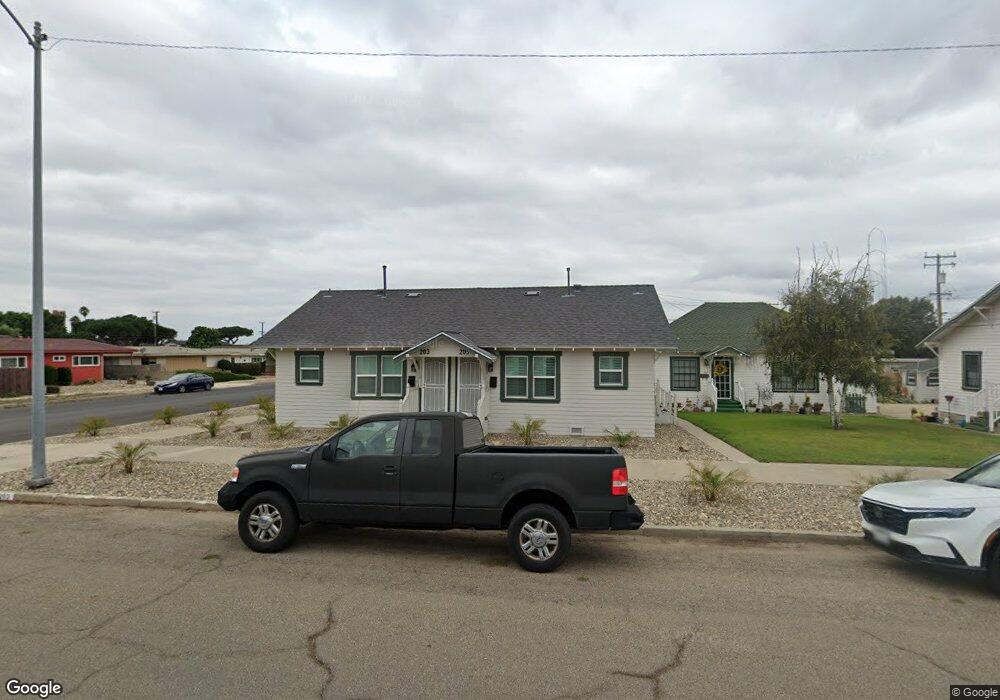
203 E Locust Ave Lompoc, CA 93436
Estimated Value: $365,000 - $785,000
Studio
--
Bath
--
Sq Ft
10,454
Sq Ft Lot
About This Home
This home is located at 203 E Locust Ave, Lompoc, CA 93436 and is currently estimated at $590,063. 203 E Locust Ave is a home located in Santa Barbara County with nearby schools including Arthur Hapgood Elementary School, Lompoc Valley Middle School, and Lompoc High School.
Ownership History
Date
Name
Owned For
Owner Type
Purchase Details
Closed on
Aug 30, 2018
Sold by
Huseman Carolyn S and Eugene I Huseman Separate Prop
Bought by
Huseman Carolyn S and Eugene L Huseman Separate Prop
Current Estimated Value
Purchase Details
Closed on
Sep 8, 2005
Sold by
Huseman Eugene L
Bought by
Huseman Eugene L
Purchase Details
Closed on
Jan 21, 1994
Sold by
Huseman James C
Bought by
Huseman Eugene L
Purchase Details
Closed on
Jan 20, 1994
Sold by
Huseman Carolyn Sue
Bought by
Huseman Eugene L
Create a Home Valuation Report for This Property
The Home Valuation Report is an in-depth analysis detailing your home's value as well as a comparison with similar homes in the area
Home Values in the Area
Average Home Value in this Area
Purchase History
| Date | Buyer | Sale Price | Title Company |
|---|---|---|---|
| Huseman Carolyn S | -- | None Available | |
| Huseman Eugene L | -- | -- | |
| Huseman Eugene L | -- | Chicago Title Company | |
| Huseman Eugene L | -- | Chicago Title Company |
Source: Public Records
Tax History
| Year | Tax Paid | Tax Assessment Tax Assessment Total Assessment is a certain percentage of the fair market value that is determined by local assessors to be the total taxable value of land and additions on the property. | Land | Improvement |
|---|---|---|---|---|
| 2025 | $2,586 | $231,926 | $72,424 | $159,502 |
| 2023 | $2,586 | $222,921 | $69,612 | $153,309 |
| 2022 | $2,539 | $218,551 | $68,248 | $150,303 |
| 2021 | $2,565 | $214,266 | $66,910 | $147,356 |
| 2020 | $2,538 | $212,070 | $66,224 | $145,846 |
| 2019 | $2,495 | $207,913 | $64,926 | $142,987 |
| 2018 | $2,456 | $203,837 | $63,653 | $140,184 |
| 2017 | $2,411 | $199,841 | $62,405 | $137,436 |
| 2016 | $2,368 | $195,924 | $61,182 | $134,742 |
| 2015 | $2,349 | $192,982 | $60,263 | $132,719 |
| 2014 | -- | $189,203 | $59,083 | $130,120 |
Source: Public Records
Map
Nearby Homes
Your Personal Tour Guide
Ask me questions while you tour the home.