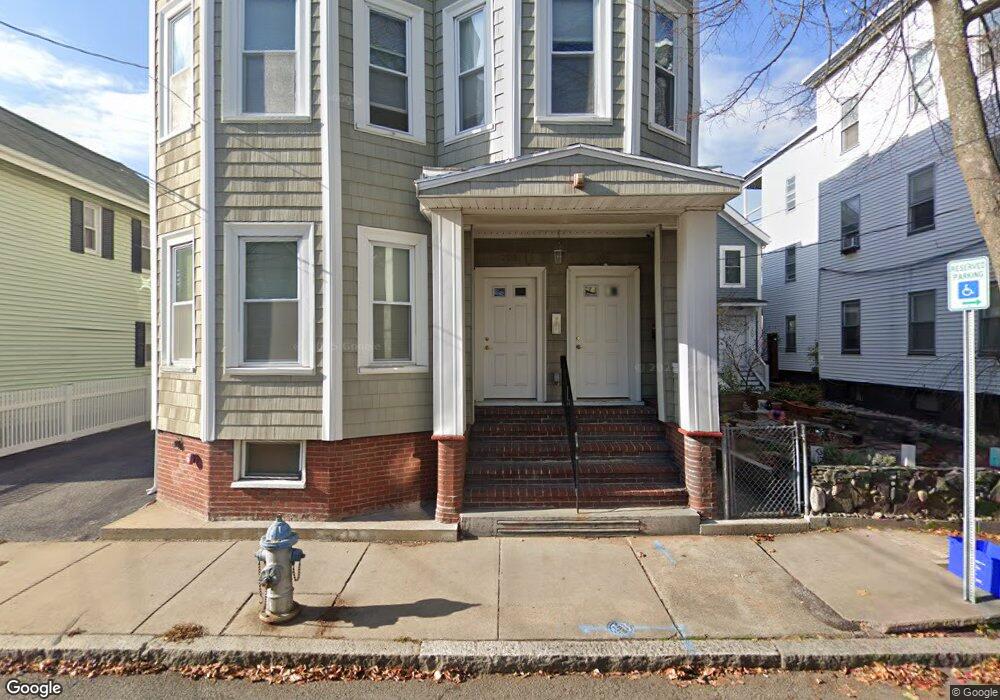
203 Elm St Unit 205 Cambridge, MA 02139
Wellington-Harrington NeighborhoodEstimated Value: $1,164,000 - $1,505,000
3
Beds
3
Baths
1,584
Sq Ft
$853/Sq Ft
Est. Value
About This Home
This home is located at 203 Elm St Unit 205, Cambridge, MA 02139 and is currently estimated at $1,351,401, approximately $853 per square foot. 203 Elm St Unit 205 is a home located in Middlesex County with nearby schools including Prospect Hill Academy Charter School and Community Charter School of Cambridge.
Ownership History
Date
Name
Owned For
Owner Type
Purchase Details
Closed on
Jul 21, 2020
Sold by
Guzior-Hoss Andrew and Hoss Jennifer L
Bought by
Hoss Ft and Guzior-Hoss
Current Estimated Value
Home Financials for this Owner
Home Financials are based on the most recent Mortgage that was taken out on this home.
Original Mortgage
$366,000
Outstanding Balance
$302,710
Interest Rate
3.1%
Mortgage Type
New Conventional
Estimated Equity
$1,048,691
Purchase Details
Closed on
Jan 26, 2017
Sold by
Hoss Jennifer L and Guzior-Hoss Andrew
Bought by
Hoss Ft and Hoss
Purchase Details
Closed on
Jan 30, 2013
Sold by
Buben Patrick Est and Mobilia
Bought by
Hoss Jennifer L and Hoss Andrew G
Home Financials for this Owner
Home Financials are based on the most recent Mortgage that was taken out on this home.
Original Mortgage
$444,000
Interest Rate
3.41%
Mortgage Type
New Conventional
Create a Home Valuation Report for This Property
The Home Valuation Report is an in-depth analysis detailing your home's value as well as a comparison with similar homes in the area
Home Values in the Area
Average Home Value in this Area
Purchase History
| Date | Buyer | Sale Price | Title Company |
|---|---|---|---|
| Hoss Ft | -- | None Available | |
| Guzior-Hoss Andrew | -- | None Available | |
| Hoss Ft | -- | -- | |
| Hoss Jennifer L | $555,000 | -- | |
| Hoss Jennifer L | $555,000 | -- | |
| Hoss Jennifer L | $555,000 | -- |
Source: Public Records
Mortgage History
| Date | Status | Borrower | Loan Amount |
|---|---|---|---|
| Open | Guzior-Hoss Andrew | $366,000 | |
| Previous Owner | Hoss Jennifer L | $444,000 |
Source: Public Records
Tax History Compared to Growth
Tax History
| Year | Tax Paid | Tax Assessment Tax Assessment Total Assessment is a certain percentage of the fair market value that is determined by local assessors to be the total taxable value of land and additions on the property. | Land | Improvement |
|---|---|---|---|---|
| 2025 | $6,521 | $1,027,000 | $0 | $1,027,000 |
| 2024 | $6,150 | $1,038,800 | $0 | $1,038,800 |
| 2023 | $5,679 | $969,100 | $0 | $969,100 |
| 2022 | $5,612 | $948,000 | $0 | $948,000 |
| 2021 | $5,465 | $934,200 | $0 | $934,200 |
| 2020 | $5,101 | $887,100 | $0 | $887,100 |
| 2019 | $4,896 | $824,200 | $0 | $824,200 |
| 2018 | $2,646 | $750,300 | $0 | $750,300 |
| 2017 | $4,558 | $702,300 | $0 | $702,300 |
| 2016 | $4,541 | $649,600 | $0 | $649,600 |
| 2015 | $4,500 | $575,500 | $0 | $575,500 |
| 2014 | $4,187 | $499,700 | $0 | $499,700 |
Source: Public Records
Map
Nearby Homes
- 43 Lincoln St
- 244 Norfolk St Unit 244
- 30 Union St Unit 1
- 392 Norfolk St Unit 1
- 114 Elm St
- 31 Tremont St
- 350 Windsor St Unit 1
- 350 Windsor St Unit 2
- 350 Windsor St
- 13 Palermo St
- 305 Webster Ave Unit 101
- 142 Amory St Unit Front
- 432 Norfolk St Unit 3J
- 432 Norfolk St Unit 4G
- 51 Market St Unit 2
- 411 Norfolk St Unit 1F
- 94 Hampshire St Unit B
- 222 Columbia St Unit 2
- 429 Norfolk St Unit 1
- 196 Prospect St
- 203 Elm St Unit 3
- 203 Elm St Unit 2
- 203 Elm St Unit 205
- 203 Elm St Unit 205
- 203 Elm St Unit 203
- 203 Elm St Unit 1
- 205 Elm St
- 205 Elm St Unit 2
- 209 Elm St
- 201 Elm St
- 201 Elm St Unit single
- 201 Elm St
- 201 Elm St Unit 201
- 201 Elm St Unit SF
- 201 Elm St Unit Single Family
- 201 Elm St Unit 1
- 211 Elm St
- 197 Elm St
- 217 Elm St
- 193 Elm St