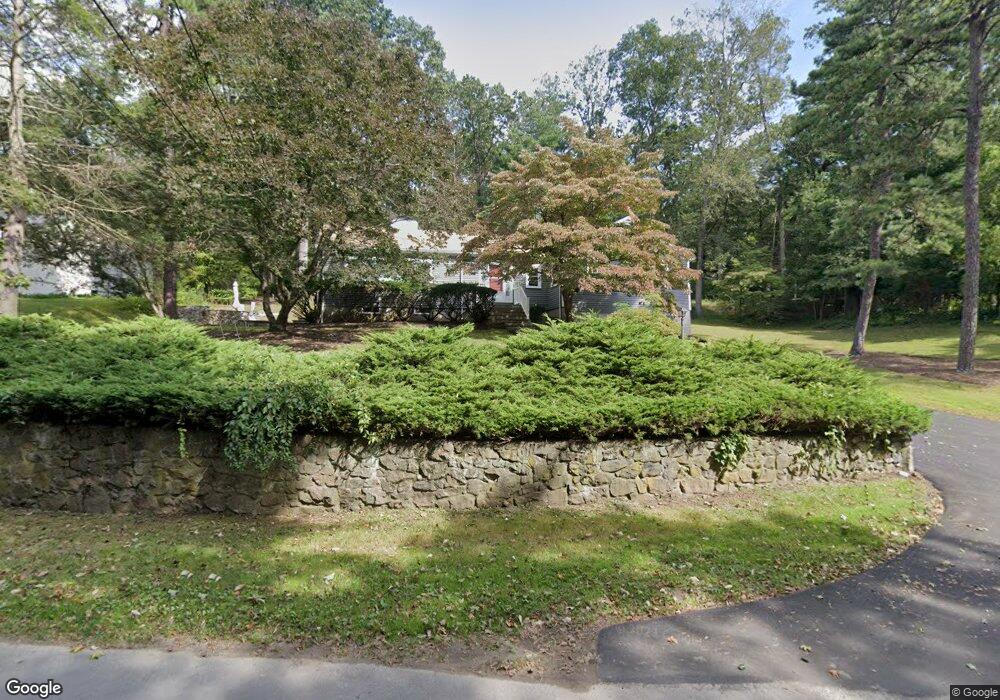
203 Fisher St Needham, MA 02492
Estimated Value: $1,333,000 - $1,535,000
3
Beds
2
Baths
1,872
Sq Ft
$773/Sq Ft
Est. Value
About This Home
This home is located at 203 Fisher St, Needham, MA 02492 and is currently estimated at $1,447,778, approximately $773 per square foot. 203 Fisher St is a home located in Norfolk County with nearby schools including Newman Elementary School, High Rock Middle School, and Pollard Middle School.
Ownership History
Date
Name
Owned For
Owner Type
Purchase Details
Closed on
Apr 30, 1996
Sold by
Yamin-Afshar Bahman and Yamin-Afshar Shifteh
Bought by
Shuman Margot P
Current Estimated Value
Home Financials for this Owner
Home Financials are based on the most recent Mortgage that was taken out on this home.
Original Mortgage
$274,000
Outstanding Balance
$15,342
Interest Rate
7.81%
Mortgage Type
Purchase Money Mortgage
Estimated Equity
$1,432,436
Create a Home Valuation Report for This Property
The Home Valuation Report is an in-depth analysis detailing your home's value as well as a comparison with similar homes in the area
Home Values in the Area
Average Home Value in this Area
Purchase History
| Date | Buyer | Sale Price | Title Company |
|---|---|---|---|
| Shuman Margot P | $342,800 | -- |
Source: Public Records
Mortgage History
| Date | Status | Borrower | Loan Amount |
|---|---|---|---|
| Open | Shuman Margot P | $274,000 | |
| Previous Owner | Shuman Margot P | $170,000 | |
| Previous Owner | Shuman Margot P | $87,000 | |
| Previous Owner | Shuman Margot P | $149,000 |
Source: Public Records
Tax History Compared to Growth
Tax History
| Year | Tax Paid | Tax Assessment Tax Assessment Total Assessment is a certain percentage of the fair market value that is determined by local assessors to be the total taxable value of land and additions on the property. | Land | Improvement |
|---|---|---|---|---|
| 2025 | $12,814 | $1,208,900 | $787,100 | $421,800 |
| 2024 | $14,129 | $1,128,500 | $712,200 | $416,300 |
| 2023 | $14,353 | $1,100,700 | $712,200 | $388,500 |
| 2022 | $12,242 | $915,600 | $539,700 | $375,900 |
| 2021 | $11,930 | $915,600 | $539,700 | $375,900 |
| 2020 | $11,592 | $928,100 | $539,700 | $388,400 |
| 2019 | $11,462 | $925,100 | $539,700 | $385,400 |
| 2018 | $10,990 | $925,100 | $539,700 | $385,400 |
| 2017 | $10,443 | $878,300 | $539,700 | $338,600 |
| 2016 | $9,021 | $781,700 | $539,700 | $242,000 |
| 2015 | $8,825 | $781,700 | $539,700 | $242,000 |
| 2014 | $9,689 | $832,400 | $539,700 | $292,700 |
Source: Public Records
Map
Nearby Homes
- 1780 Central Ave
- 46 Charles River St
- 52 Willow St
- 365 Charles River St
- 1266 South St
- 37 Carleton Dr
- 60 Claybrook Rd
- 150 Dedham St
- 12 Haven St
- 78 Pheasant Landing Rd
- 90 Burr Dr
- 3 Burnham Rd
- 15-19 Strawberry Hill St
- 24 Deerfield Rd
- 267 Dedham St
- 957 South St
- 60 Locust Ln
- 287 High Rock St
- 30 Richardson Dr
- 29 Tolman St