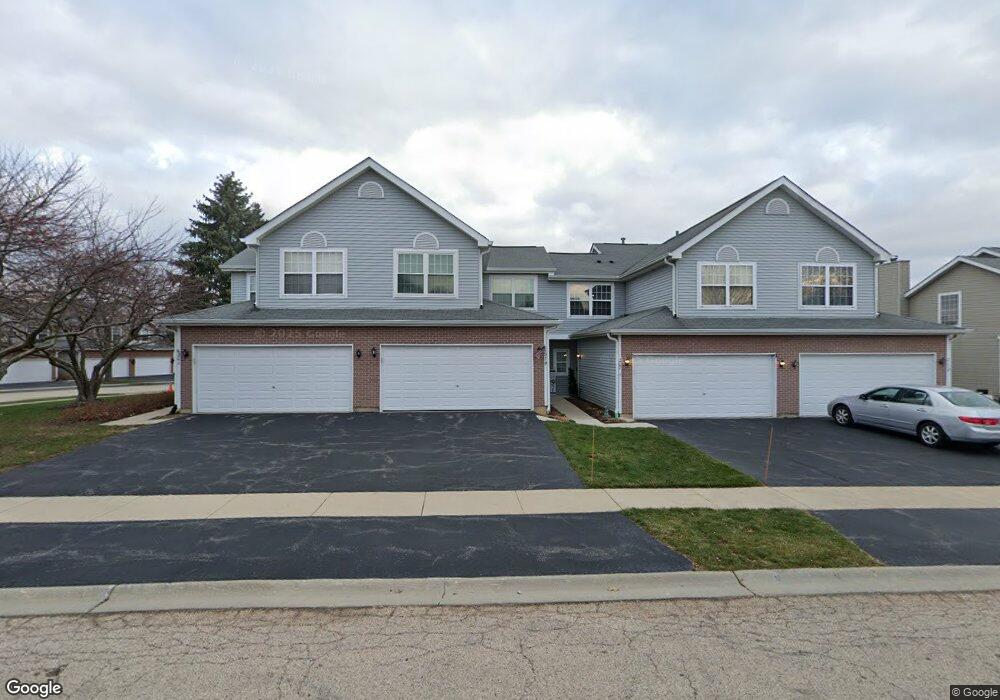
203 Grandview Ct Algonquin, IL 60102
Estimated Value: $281,053 - $296,000
2
Beds
3
Baths
1,398
Sq Ft
$208/Sq Ft
Est. Value
About This Home
This home is located at 203 Grandview Ct, Algonquin, IL 60102 and is currently estimated at $290,263, approximately $207 per square foot. 203 Grandview Ct is a home located in McHenry County with nearby schools including Westfield Community School, Kenneth E Neubert Elementary School, and United Junior High School.
Ownership History
Date
Name
Owned For
Owner Type
Purchase Details
Closed on
Aug 2, 2011
Sold by
Bowski Gloria
Bought by
Bowski Gloria and Gloria Bowski Trust
Current Estimated Value
Purchase Details
Closed on
Apr 22, 2005
Sold by
Giuliano John G and Giuliano Raffaella
Bought by
Bowski Gloria
Purchase Details
Closed on
Mar 25, 1999
Sold by
Spaid Lisa R and Spaid Richard D
Bought by
Giuliano Giovanni John and Giuliano Raffaella
Home Financials for this Owner
Home Financials are based on the most recent Mortgage that was taken out on this home.
Original Mortgage
$119,530
Interest Rate
6.89%
Mortgage Type
FHA
Purchase Details
Closed on
Nov 1, 1994
Sold by
Maywood Proviso State Bank
Bought by
Spaid Richard D and Lopardo Lisa R
Home Financials for this Owner
Home Financials are based on the most recent Mortgage that was taken out on this home.
Original Mortgage
$109,300
Interest Rate
9%
Create a Home Valuation Report for This Property
The Home Valuation Report is an in-depth analysis detailing your home's value as well as a comparison with similar homes in the area
Home Values in the Area
Average Home Value in this Area
Purchase History
| Date | Buyer | Sale Price | Title Company |
|---|---|---|---|
| Bowski Gloria | -- | None Available | |
| Bowski Gloria | $185,000 | Ticor Title | |
| Giuliano Giovanni John | $120,500 | -- | |
| Spaid Richard D | $122,000 | -- |
Source: Public Records
Mortgage History
| Date | Status | Borrower | Loan Amount |
|---|---|---|---|
| Previous Owner | Giuliano Giovanni John | $119,530 | |
| Previous Owner | Spaid Richard D | $109,300 |
Source: Public Records
Tax History Compared to Growth
Tax History
| Year | Tax Paid | Tax Assessment Tax Assessment Total Assessment is a certain percentage of the fair market value that is determined by local assessors to be the total taxable value of land and additions on the property. | Land | Improvement |
|---|---|---|---|---|
| 2024 | $1,563 | $75,102 | $13,825 | $61,277 |
| 2023 | $1,673 | $67,170 | $12,365 | $54,805 |
| 2022 | $2,142 | $56,947 | $11,160 | $45,787 |
| 2021 | $2,217 | $53,053 | $10,397 | $42,656 |
| 2020 | $2,243 | $51,175 | $10,029 | $41,146 |
| 2019 | $2,294 | $48,981 | $9,599 | $39,382 |
| 2018 | $2,381 | $43,417 | $8,867 | $34,550 |
| 2017 | $2,488 | $40,901 | $8,353 | $32,548 |
| 2016 | $2,627 | $38,361 | $7,834 | $30,527 |
| 2013 | -- | $46,106 | $7,308 | $38,798 |
Source: Public Records
Map
Nearby Homes
- 16 Brian Ct
- 266 Grandview Ct
- 909 Roger St
- 1431 Essex St
- LOT 3 Blackhawk Dr
- 807 Menominee Dr
- 809 Menominee Dr
- 135 Arquilla Dr
- Lots 10 & 11 Ramble Rd
- 1235 Fairmont Ct
- 900 Windstone Ct
- 937 Mesa Dr
- 721 Brentwood Ct
- 700 Fairfield Ln
- 305 Buckingham Dr
- 70 Hilltop Dr Unit 4
- 113 Pheasant Trail
- 992 Mcphee Dr
- 1019 Maple St
- 615 Harper Dr
- 207 Grandview Ct Unit 2
- 201 Grandview Ct Unit 2
- 211 Grandview Ct Unit 2
- 3 Brian Ct
- 215 Grandview Ct
- 5 Brian Ct
- 219 Grandview Ct
- 219 Grandview Ct Unit 219
- 7 Brian Ct
- 200 Grandview Ct
- 223 Grandview Ct
- 223 Grandview Ct Unit 203
- 1350 Essex St
- 9 Brian Ct
- 1330 Grandview Ct
- 227 Grandview Ct Unit 2
- 1334 Grandview Ct
- 1334 Grandview Ct Unit 1334
- 1354 Essex St Unit 2
- 2 Brian Ct