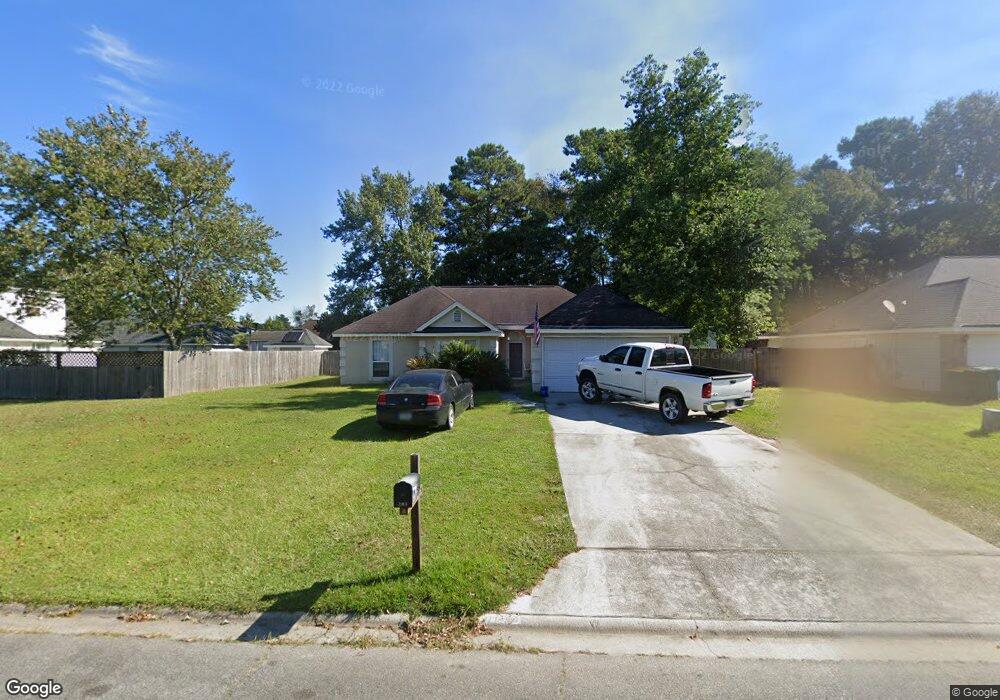
203 Longleaf Cir Pooler, GA 31322
Estimated Value: $252,281 - $288,000
3
Beds
2
Baths
1,356
Sq Ft
$204/Sq Ft
Est. Value
About This Home
This home is located at 203 Longleaf Cir, Pooler, GA 31322 and is currently estimated at $277,070, approximately $204 per square foot. 203 Longleaf Cir is a home located in Chatham County with nearby schools including West Chatham Elementary School, West Chatham Middle School, and New Hampstead High School.
Ownership History
Date
Name
Owned For
Owner Type
Purchase Details
Closed on
Feb 28, 2022
Sold by
Bb203 Llc
Bought by
Elkins Jeffery Lee
Current Estimated Value
Home Financials for this Owner
Home Financials are based on the most recent Mortgage that was taken out on this home.
Original Mortgage
$142,500
Outstanding Balance
$132,181
Interest Rate
3.92%
Mortgage Type
New Conventional
Estimated Equity
$144,889
Purchase Details
Closed on
Jul 20, 2017
Sold by
Brooks Steven D
Bought by
Bb203 Llc
Purchase Details
Closed on
Dec 29, 2004
Sold by
Va
Bought by
Brooks Steven D
Home Financials for this Owner
Home Financials are based on the most recent Mortgage that was taken out on this home.
Original Mortgage
$119,711
Interest Rate
5.71%
Mortgage Type
New Conventional
Purchase Details
Closed on
Jul 6, 2004
Sold by
Doane Samuel H and Doane Kim Y
Bought by
Countrywide Home Loans Inc
Create a Home Valuation Report for This Property
The Home Valuation Report is an in-depth analysis detailing your home's value as well as a comparison with similar homes in the area
Home Values in the Area
Average Home Value in this Area
Purchase History
| Date | Buyer | Sale Price | Title Company |
|---|---|---|---|
| Elkins Jeffery Lee | $150,000 | -- | |
| Bb203 Llc | -- | -- | |
| Brooks Steven D | -- | -- | |
| Brooks Steven D | $126,012 | -- | |
| Countrywide Home Loans Inc | $127,119 | -- | |
| Va | -- | -- |
Source: Public Records
Mortgage History
| Date | Status | Borrower | Loan Amount |
|---|---|---|---|
| Open | Elkins Jeffery Lee | $142,500 | |
| Previous Owner | Brooks Steven D | $119,711 |
Source: Public Records
Tax History
| Year | Tax Paid | Tax Assessment Tax Assessment Total Assessment is a certain percentage of the fair market value that is determined by local assessors to be the total taxable value of land and additions on the property. | Land | Improvement |
|---|---|---|---|---|
| 2025 | $3,578 | $108,880 | $26,000 | $82,880 |
| 2024 | $19 | $86,440 | $18,000 | $68,440 |
| 2023 | $1,916 | $60,000 | $11,880 | $48,120 |
| 2022 | $2,215 | $72,920 | $12,000 | $60,920 |
| 2021 | $2,335 | $64,640 | $12,000 | $52,640 |
| 2020 | $1,944 | $58,000 | $12,000 | $46,000 |
| 2019 | $1,944 | $56,880 | $12,000 | $44,880 |
| 2018 | $1,582 | $55,200 | $12,000 | $43,200 |
| 2017 | $1,582 | $49,400 | $10,000 | $39,400 |
| 2016 | $1,582 | $49,320 | $10,000 | $39,320 |
| 2015 | $1,607 | $49,840 | $10,000 | $39,840 |
| 2014 | $2,446 | $50,520 | $0 | $0 |
Source: Public Records
Map
Nearby Homes
- 22 Chamois Ct
- 248 Longleaf Cir
- 104 Redfield Dr
- 221 Merganser Dr
- 80 Woodford Reserve Dr
- 81 Woodford Reserve Dr
- 119 Holloway Hill
- 126 Holloway Hill
- 167 Holloway Hill
- 33 Woodford Reserve Dr
- 14 Woodford Reserve Dr
- 12 Woodford Reserve Dr
- 301 Merganser Dr
- 110 Chime Creek Dr
- 310 Merganser Dr
- 109 Pinebury Rd
- 107 Pinebury Rd
- 111 Pinebury Rd
- 103 Pineburry Rd
- 139 Classic Dr
- 205 Longleaf Cir
- 1 Browning Dr
- 3 Browning Dr
- 207 Longleaf Cir
- 5 Browning Dr
- 206 Longleaf Cir
- 204 Longleaf Cir
- 208 Longleaf Cir
- 7 Browning Dr
- 209 Longleaf Cir
- 202 Longleaf Cir
- 210 Longleaf Cir
- 9 Browning Dr
- 136 Longleaf Cir
- 123 Longleaf Cir
- 216 Cassidy Way
- 211 Longleaf Cir
- 4 Browning Dr
- 214 Cassidy Way
- 218 Cassidy Way
Your Personal Tour Guide
Ask me questions while you tour the home.