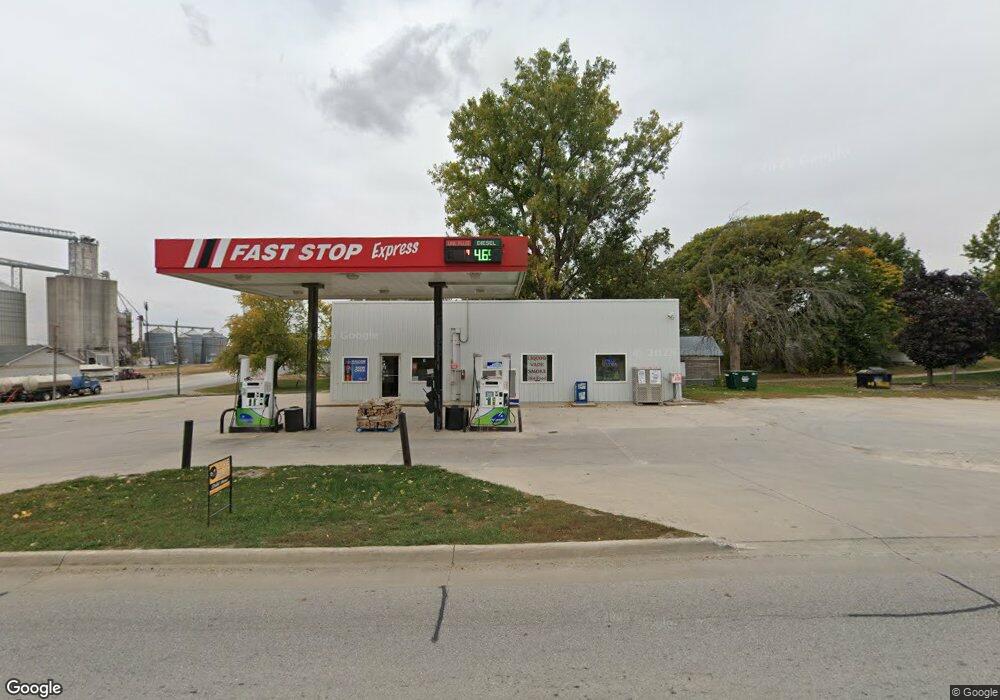
203 Montezuma St Malcom, IA 50157
Estimated Value: $48,884
Studio
--
Bath
1,612
Sq Ft
$30/Sq Ft
Est. Value
About This Home
This home is located at 203 Montezuma St, Malcom, IA 50157 and is currently priced at $48,884, approximately $30 per square foot. 203 Montezuma St is a home located in Poweshiek County with nearby schools including Brooklyn-Guernsey-Malcom Elementary School and Brooklyn-Guernsey-Malcom Junior/Senior High School.
Ownership History
Date
Name
Owned For
Owner Type
Purchase Details
Closed on
Apr 30, 2021
Sold by
Wmd Gas & Co Llc
Bought by
Malcom Gas & Food Llc
Current Estimated Value
Purchase Details
Closed on
Dec 28, 2012
Sold by
Patriot Bank
Bought by
Wmd Gas & Go Llc
Purchase Details
Closed on
Oct 5, 2007
Sold by
Cline & Cline Llc
Bought by
Fls Enterprises Llc
Home Financials for this Owner
Home Financials are based on the most recent Mortgage that was taken out on this home.
Original Mortgage
$196,500
Interest Rate
6.55%
Mortgage Type
Future Advance Clause Open End Mortgage
Create a Home Valuation Report for This Property
The Home Valuation Report is an in-depth analysis detailing your home's value as well as a comparison with similar homes in the area
Purchase History
| Date | Buyer | Sale Price | Title Company |
|---|---|---|---|
| Malcom Gas & Food Llc | $40,000 | None Available | |
| Wmd Gas & Go Llc | $19,500 | None Available | |
| Fls Enterprises Llc | $161,000 | None Available |
Source: Public Records
Mortgage History
| Date | Status | Borrower | Loan Amount |
|---|---|---|---|
| Previous Owner | Fls Enterprises Llc | $196,500 |
Source: Public Records
Tax History
| Year | Tax Paid | Tax Assessment Tax Assessment Total Assessment is a certain percentage of the fair market value that is determined by local assessors to be the total taxable value of land and additions on the property. | Land | Improvement |
|---|---|---|---|---|
| 2025 | $1,834 | $121,230 | $20,410 | $100,820 |
| 2024 | $1,760 | $113,800 | $18,550 | $95,250 |
| 2023 | $1,162 | $113,800 | $18,550 | $95,250 |
| 2022 | $1,302 | $64,640 | $8,160 | $56,480 |
| 2021 | $1,302 | $64,640 | $8,160 | $56,480 |
| 2020 | $1,352 | $64,640 | $8,160 | $56,480 |
| 2019 | $1,258 | $64,640 | $8,160 | $56,480 |
| 2018 | $1,250 | $58,480 | $7,420 | $51,060 |
| 2017 | $1,266 | $58,480 | $7,420 | $51,060 |
| 2016 | $1,208 | $58,480 | $7,420 | $51,060 |
| 2015 | -- | $58,480 | $7,420 | $51,060 |
| 2014 | -- | $58,600 | $7,620 | $50,980 |
Source: Public Records
Map
Nearby Homes
- 303 Clay St
- 4182 160th St
- 215 Brady St
- 528 W Pershing Dr
- 515 W Des Moines St
- 505 W Pershing Dr
- 511 N Orchard St
- 404 W Des Moines St
- 611 Broadway St
- 508 Williams St
- 144 Center Point Dr
- 174A Center Point Dr
- 4854 103rd St
- 135 Crabtree Rd
- 420 390th Ave
- 204 Eastside Ln
- 380 Timber Ridge
- 226 & 228 Center Point Dr
- 101 Canyon Rd
- 212 Eastside Ln
Your Personal Tour Guide
Ask me questions while you tour the home.