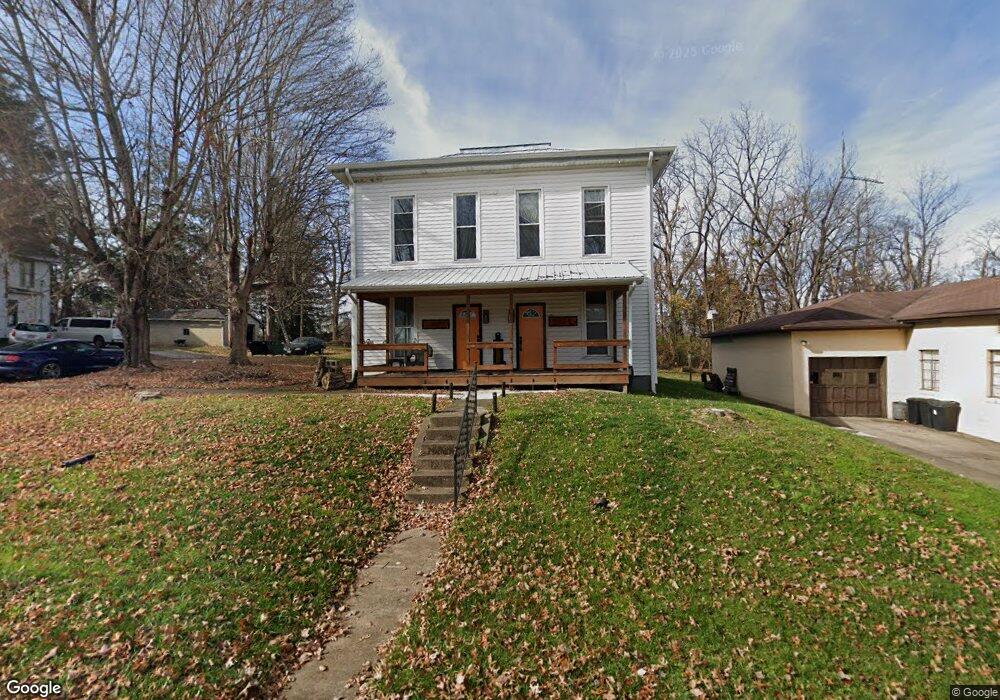
203 N High St Jackson, OH 45640
Estimated Value: $109,000 - $225,000
4
Beds
2
Baths
2,310
Sq Ft
$68/Sq Ft
Est. Value
About This Home
This home is located at 203 N High St, Jackson, OH 45640 and is currently estimated at $158,082, approximately $68 per square foot. 203 N High St is a home located in Jackson County with nearby schools including Jackson High School and Christian Life Academy.
Ownership History
Date
Name
Owned For
Owner Type
Purchase Details
Closed on
Jun 25, 2021
Sold by
Ochsenbein Karen P
Bought by
17 Cities Llc
Current Estimated Value
Home Financials for this Owner
Home Financials are based on the most recent Mortgage that was taken out on this home.
Original Mortgage
$37,600
Outstanding Balance
$28,737
Interest Rate
2.9%
Mortgage Type
Commercial
Estimated Equity
$129,345
Purchase Details
Closed on
Sep 8, 2011
Sold by
Cartwright D Jean
Bought by
Ochsenbein Karen P
Purchase Details
Closed on
Jul 31, 2000
Sold by
Miller Adyron B
Bought by
Miller Adyron B
Create a Home Valuation Report for This Property
The Home Valuation Report is an in-depth analysis detailing your home's value as well as a comparison with similar homes in the area
Home Values in the Area
Average Home Value in this Area
Purchase History
| Date | Buyer | Sale Price | Title Company |
|---|---|---|---|
| 17 Cities Llc | $47,000 | None Available | |
| Ochsenbein Karen P | $30,000 | None Available | |
| Miller Adyron B | -- | -- |
Source: Public Records
Mortgage History
| Date | Status | Borrower | Loan Amount |
|---|---|---|---|
| Open | 17 Cities Llc | $37,600 |
Source: Public Records
Tax History Compared to Growth
Tax History
| Year | Tax Paid | Tax Assessment Tax Assessment Total Assessment is a certain percentage of the fair market value that is determined by local assessors to be the total taxable value of land and additions on the property. | Land | Improvement |
|---|---|---|---|---|
| 2024 | $1,454 | $39,190 | $6,380 | $32,810 |
| 2023 | $1,480 | $39,190 | $6,380 | $32,810 |
| 2022 | $1,625 | $31,870 | $6,000 | $25,870 |
| 2021 | $1,297 | $31,870 | $6,000 | $25,870 |
| 2020 | $1,286 | $31,870 | $6,000 | $25,870 |
| 2019 | $1,135 | $28,200 | $5,310 | $22,890 |
| 2018 | $1,093 | $28,200 | $5,310 | $22,890 |
| 2017 | $1,101 | $29,700 | $5,310 | $24,390 |
| 2016 | $1,366 | $36,370 | $5,200 | $31,170 |
| 2015 | $1,374 | $36,370 | $5,200 | $31,170 |
| 2013 | $1,315 | $34,890 | $5,200 | $29,690 |
| 2012 | $1,334 | $34,890 | $5,200 | $29,690 |
Source: Public Records
Map
Nearby Homes