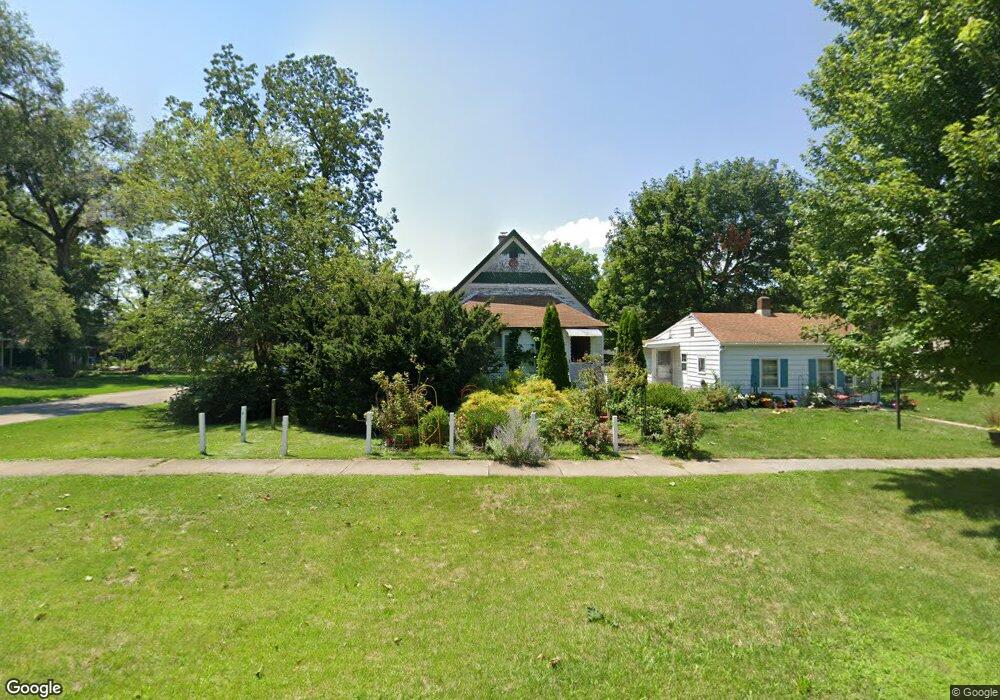
203 N Walnut St Momence, IL 60954
Estimated Value: $107,269 - $162,000
2
Beds
1
Bath
1,000
Sq Ft
$132/Sq Ft
Est. Value
About This Home
This home is located at 203 N Walnut St, Momence, IL 60954 and is currently estimated at $132,067, approximately $132 per square foot. 203 N Walnut St is a home located in Kankakee County with nearby schools including Momence Junior High School, Je-Neir Elementary School, and Momence High School.
Create a Home Valuation Report for This Property
The Home Valuation Report is an in-depth analysis detailing your home's value as well as a comparison with similar homes in the area
Home Values in the Area
Average Home Value in this Area
Tax History
| Year | Tax Paid | Tax Assessment Tax Assessment Total Assessment is a certain percentage of the fair market value that is determined by local assessors to be the total taxable value of land and additions on the property. | Land | Improvement |
|---|---|---|---|---|
| 2024 | $1,715 | $21,850 | $5,726 | $16,124 |
| 2023 | $1,518 | $18,998 | $5,205 | $13,793 |
| 2022 | $1,415 | $17,363 | $4,732 | $12,631 |
| 2021 | $1,332 | $17,231 | $4,732 | $12,499 |
| 2020 | $1,360 | $16,066 | $4,685 | $11,381 |
| 2019 | $1,240 | $14,403 | $4,639 | $9,764 |
| 2018 | $1,196 | $13,916 | $4,482 | $9,434 |
| 2017 | $1,182 | $13,779 | $4,438 | $9,341 |
| 2016 | $1,144 | $13,379 | $4,362 | $9,017 |
| 2015 | $1,142 | $13,247 | $4,319 | $8,928 |
| 2014 | $1,143 | $13,403 | $4,407 | $8,996 |
| 2013 | -- | $15,578 | $4,532 | $11,046 |
Source: Public Records
Map
Nearby Homes
- 203 N Maple St
- 212 N Pine St
- 120 E 6th St
- 9 Maple Island St
- 327 E Ohio St
- 516 W 2nd St
- 322 N Franklin St
- Section 18 E Deerson St
- 209 W Indiana St
- 10443 E River North Rd
- 946 Louise Dr
- 3999 Illinois 1
- 12605 E Metcalf Ave
- Six Mile Grove Sub 04-31-14e
- 1221 N State Route 1 17
- 000 Industrial Dr Rd
- 110-176 Stirling Place
- 691 N State Route 1 17
- 2709 N River Isle Rd
- 6039 N 14000e Rd
- 207 N Walnut St
- Lots 127-151 E 2nd St
- 213 N Walnut St
- 125 N Walnut St
- 223 N Walnut St
- 126 N Walnut St
- 121 N Walnut St
- 210 N Locust St
- 227 E 3rd St
- 219 E 3rd St
- 120 N Walnut St
- 212 N Locust St
- 311 E 3rd St
- 202 N Locust St
- 211 E 3rd St
- 305 E 3rd St
- 315 E 3rd St
- 216 E Washington St
- 226 N Locust St
- 125 N Maple St
Your Personal Tour Guide
Ask me questions while you tour the home.