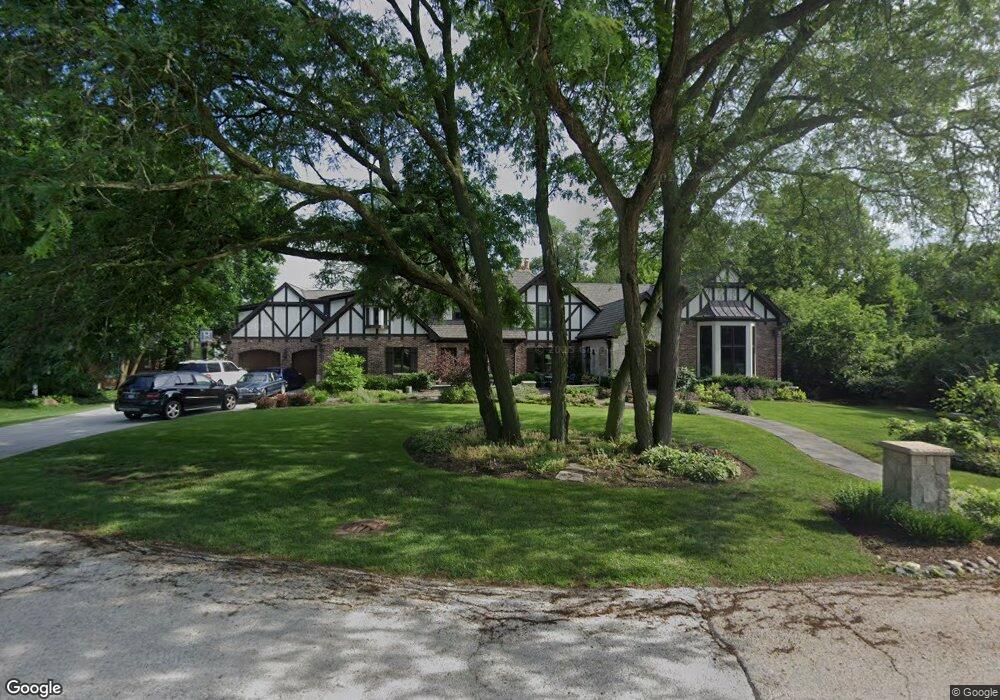
203 Prospect Ct Prospect Heights, IL 60070
Estimated Value: $632,229 - $882,000
3
Beds
3
Baths
2,576
Sq Ft
$285/Sq Ft
Est. Value
About This Home
This home is located at 203 Prospect Ct, Prospect Heights, IL 60070 and is currently estimated at $734,307, approximately $285 per square foot. 203 Prospect Ct is a home located in Cook County with nearby schools including Dwight D Eisenhower Elementary School, Anne Sullivan Elementary School, and Betsy Ross Elementary School.
Ownership History
Date
Name
Owned For
Owner Type
Purchase Details
Closed on
Dec 18, 2006
Sold by
Day John P and Helbling Alison M
Bought by
Helbling Alison M and Alison M Helbling 2006 Qtip Trust
Current Estimated Value
Purchase Details
Closed on
Jul 17, 1998
Sold by
Livin Hargus Roger C
Bought by
Day John P and Helbling Alison M
Home Financials for this Owner
Home Financials are based on the most recent Mortgage that was taken out on this home.
Original Mortgage
$309,600
Outstanding Balance
$59,028
Interest Rate
7.15%
Estimated Equity
$675,279
Create a Home Valuation Report for This Property
The Home Valuation Report is an in-depth analysis detailing your home's value as well as a comparison with similar homes in the area
Home Values in the Area
Average Home Value in this Area
Purchase History
| Date | Buyer | Sale Price | Title Company |
|---|---|---|---|
| Helbling Alison M | -- | None Available | |
| Day John P | $387,000 | -- |
Source: Public Records
Mortgage History
| Date | Status | Borrower | Loan Amount |
|---|---|---|---|
| Open | Day John P | $309,600 |
Source: Public Records
Tax History
| Year | Tax Paid | Tax Assessment Tax Assessment Total Assessment is a certain percentage of the fair market value that is determined by local assessors to be the total taxable value of land and additions on the property. | Land | Improvement |
|---|---|---|---|---|
| 2025 | $12,632 | $59,000 | $9,572 | $49,428 |
| 2024 | $12,632 | $48,000 | $7,658 | $40,342 |
| 2023 | $11,791 | $48,000 | $7,658 | $40,342 |
| 2022 | $11,791 | $48,000 | $7,658 | $40,342 |
| 2021 | $10,918 | $39,293 | $6,700 | $32,593 |
| 2020 | $10,704 | $39,293 | $6,700 | $32,593 |
| 2019 | $10,708 | $43,952 | $6,700 | $37,252 |
| 2018 | $12,513 | $46,661 | $5,743 | $40,918 |
| 2017 | $13,231 | $46,661 | $5,743 | $40,918 |
| 2016 | $12,566 | $46,661 | $5,743 | $40,918 |
| 2015 | $12,122 | $41,204 | $4,786 | $36,418 |
| 2014 | $12,011 | $41,204 | $4,786 | $36,418 |
| 2013 | $11,697 | $41,204 | $4,786 | $36,418 |
Source: Public Records
Map
Nearby Homes
- 200 N Pine St
- 101 N Schoenbeck Rd
- 250 W Parliament Place Unit 301
- 1210 N Dale Ave Unit 2I
- 802 Butternut Ln Unit D
- 1401 Plum Ct Unit D
- 1400 N Yarmouth Place Unit 407
- 1414 N Bridgeport Dr Unit T31
- 1403 Clove Ct Unit B
- 2443 E Brandenberry Ct Unit 2A
- 1010 Butternut Ln Unit B
- 1454 N Elmhurst Rd Unit 102B
- 2315 E Olive St Unit 2B
- 740 Creekside Dr Unit 510D
- 730 Creekside Dr Unit 209C
- 730 Creekside Dr Unit 405C
- 206 E Camp Mcdonald Rd
- 802 Andover Ct
- 720 Creekside Dr Unit 503B
- 710 Creekside Dr Unit 104A
- 205 Prospect Ct
- 202 E Circle Ave
- 204 E Circle Ave
- 200 Prospect Ct
- 301 W Marion St
- 304 W Olive Ave
- 209 W Circle Ave
- 202 Prospect Ct
- 206 E Circle Ave
- 110 Prospect Ct
- 211 W Circle Ave
- 303 W Marion St
- 208 E Circle Ave
- 205 E Circle Ave
- 201 N Schoenbeck Rd
- 203 E Circle Ave
- 109 Prospect Ct
- 205 N Schoenbeck Rd
- 305 W Marion St
- 203 N Schoenbeck Rd
Your Personal Tour Guide
Ask me questions while you tour the home.