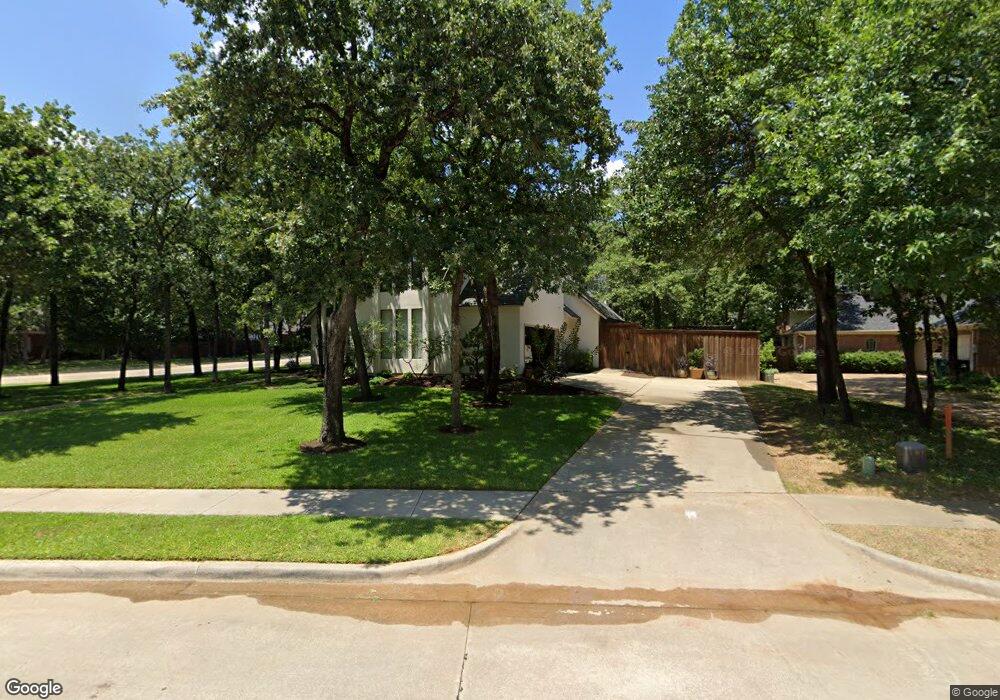
203 Royal Oaks Place Denton, TX 76210
South Denton NeighborhoodEstimated Value: $590,000 - $659,000
3
Beds
3
Baths
2,965
Sq Ft
$211/Sq Ft
Est. Value
About This Home
This home is located at 203 Royal Oaks Place, Denton, TX 76210 and is currently estimated at $627,074, approximately $211 per square foot. 203 Royal Oaks Place is a home located in Denton County with nearby schools including Ryan Elementary School, McMath Middle School, and Denton High School.
Ownership History
Date
Name
Owned For
Owner Type
Purchase Details
Closed on
Mar 23, 2016
Sold by
Baluch Holdings Llc
Bought by
Stewart Nancy Kay
Current Estimated Value
Home Financials for this Owner
Home Financials are based on the most recent Mortgage that was taken out on this home.
Original Mortgage
$210,000
Outstanding Balance
$165,759
Interest Rate
3.65%
Mortgage Type
New Conventional
Estimated Equity
$461,315
Purchase Details
Closed on
Sep 24, 2014
Sold by
Elliott Bruce
Bought by
Baluch Holdings Llc
Home Financials for this Owner
Home Financials are based on the most recent Mortgage that was taken out on this home.
Original Mortgage
$220,141
Interest Rate
4.13%
Mortgage Type
Purchase Money Mortgage
Purchase Details
Closed on
Jun 25, 2014
Sold by
Keller Jeffrey Bryan and Keeler Eric Ashley
Bought by
Elliott Bruce
Purchase Details
Closed on
Oct 5, 1994
Sold by
Lodge Construction Company Inc
Bought by
Gossett Construction Co Inc
Create a Home Valuation Report for This Property
The Home Valuation Report is an in-depth analysis detailing your home's value as well as a comparison with similar homes in the area
Home Values in the Area
Average Home Value in this Area
Purchase History
| Date | Buyer | Sale Price | Title Company |
|---|---|---|---|
| Stewart Nancy Kay | -- | Attorney | |
| Baluch Holdings Llc | -- | None Available | |
| Elliott Bruce | -- | None Available | |
| Gossett Construction Co Inc | -- | -- | |
| Gossett Construction Co Inc | -- | -- |
Source: Public Records
Mortgage History
| Date | Status | Borrower | Loan Amount |
|---|---|---|---|
| Open | Stewart Nancy Kay | $210,000 | |
| Previous Owner | Baluch Holdings Llc | $220,141 |
Source: Public Records
Tax History Compared to Growth
Tax History
| Year | Tax Paid | Tax Assessment Tax Assessment Total Assessment is a certain percentage of the fair market value that is determined by local assessors to be the total taxable value of land and additions on the property. | Land | Improvement |
|---|---|---|---|---|
| 2025 | $5,546 | $607,100 | $191,062 | $456,238 |
| 2024 | $10,653 | $551,909 | $0 | $0 |
| 2023 | $5,555 | $501,735 | $218,357 | $498,429 |
| 2022 | $9,683 | $456,123 | $136,473 | $347,886 |
| 2021 | $9,218 | $424,820 | $108,740 | $316,080 |
| 2020 | $8,616 | $376,961 | $108,740 | $268,221 |
| 2019 | $8,934 | $374,407 | $108,740 | $265,667 |
| 2018 | $8,590 | $355,615 | $108,740 | $246,875 |
| 2017 | $8,445 | $341,641 | $108,740 | $232,901 |
| 2016 | $7,836 | $306,635 | $72,493 | $234,142 |
| 2015 | $6,372 | $277,556 | $72,493 | $205,063 |
| 2014 | $6,372 | $254,664 | $72,493 | $182,171 |
| 2013 | -- | $288,876 | $63,431 | $225,445 |
Source: Public Records
Map
Nearby Homes
- 9 Royal Oaks Cir
- 3916 Maggies Meadow
- 21 Wellington Oaks Cir
- 33 Oak Forrest Cir
- 9 Oak Forrest Cir
- 100 Bentwood Ct
- 4100 Willow Grove Ave
- 4200 Thistle Hill
- 3601 Montecito Dr
- Type - 2 Plan at Ryan Woods
- 900 Mallard Ave
- 813 Turtle Creek Ave
- 3612 Granada Trail
- 3805 Granada Trail
- 409 Meadowlands Dr
- 4212 Stonetrail Dr
- 28 Timbergreen Cir
- 917 Fallbrook Ave
- 5508 Thistle Hill
- 3808 Montecito Dr
- 1 Royal Oaks Cir
- 202 Wellington Oaks Ct
- 206 Wellington Oaks Ct
- 208 Royal Oaks Place
- 204 Royal Oaks Place
- 211 Royal Oaks Place
- 44 Wellington Oaks Cir
- 3 Royal Oaks Cir
- 210 Wellington Oaks Ct
- 2 Royal Oaks Cir
- 216 Royal Oaks Place
- 212 Royal Oaks Place
- 42 Wellington Oaks Cir
- 5 Royal Oaks Cir
- 205 Royal Oaks Ct
- 201 Royal Oaks Ct
- 201 Wellington Oaks Ct
- 4 Royal Oaks Cir
- 209 Royal Oaks Ct
- 209 Wellington Oaks Ct