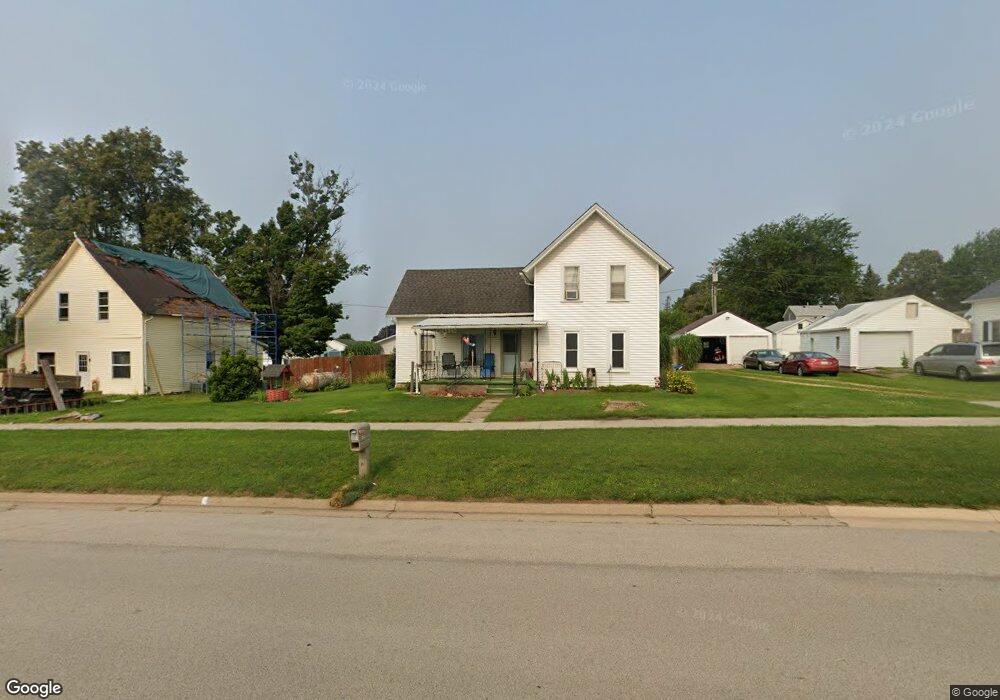
203 S Main St Onslow, IA 52321
Estimated Value: $105,000 - $145,000
3
Beds
3
Baths
1,448
Sq Ft
$84/Sq Ft
Est. Value
About This Home
This home is located at 203 S Main St, Onslow, IA 52321 and is currently estimated at $122,243, approximately $84 per square foot. 203 S Main St is a home with nearby schools including Midland Elementary School and Midland Middle/High School.
Ownership History
Date
Name
Owned For
Owner Type
Purchase Details
Closed on
Jan 7, 2025
Sold by
Bahnsen Kevin D and Wenzel Sammuel B
Bought by
Wenzel Sammuel B
Current Estimated Value
Purchase Details
Closed on
Nov 16, 2009
Sold by
Holerud Shirley C and Holerud Dean
Bought by
Bahnsen Kevin D
Create a Home Valuation Report for This Property
The Home Valuation Report is an in-depth analysis detailing your home's value as well as a comparison with similar homes in the area
Home Values in the Area
Average Home Value in this Area
Purchase History
| Date | Buyer | Sale Price | Title Company |
|---|---|---|---|
| Wenzel Sammuel B | -- | None Listed On Document | |
| Bahnsen Kevin D | $40,000 | None Available |
Source: Public Records
Tax History Compared to Growth
Tax History
| Year | Tax Paid | Tax Assessment Tax Assessment Total Assessment is a certain percentage of the fair market value that is determined by local assessors to be the total taxable value of land and additions on the property. | Land | Improvement |
|---|---|---|---|---|
| 2025 | $950 | $85,300 | $4,770 | $80,530 |
| 2024 | $950 | $73,770 | $4,770 | $69,000 |
| 2023 | $1,028 | $73,770 | $4,770 | $69,000 |
| 2022 | $878 | $61,400 | $4,770 | $56,630 |
| 2021 | $878 | $61,400 | $4,770 | $56,630 |
| 2020 | $892 | $57,350 | $4,770 | $52,580 |
| 2019 | $888 | $57,350 | $4,770 | $52,580 |
| 2018 | $868 | $54,210 | $8,390 | $45,820 |
| 2017 | $882 | $54,210 | $8,390 | $45,820 |
| 2016 | $852 | $54,210 | $8,390 | $45,820 |
| 2015 | $852 | $54,210 | $8,390 | $45,820 |
| 2014 | $864 | $52,110 | $6,290 | $45,820 |
| 2013 | $728 | $52,110 | $6,290 | $45,820 |
Source: Public Records
Map
Nearby Homes
- 305 N Main St
- 8212 98th St
- 8133 98th St
- 201 N Maple St
- 305 W Main St
- 511 E Webster St
- 000 30th Ave
- 3000 150th St
- 406 Broadway St
- 00 110th Ave
- 4993 151st St
- 000 50th Ave
- 302 Walnut St
- 9162 Richland Rd
- 108 Wood Ridge Rd
- 823 Timberline Rd
- 128 Woodridge Rd
- 439 Council St
- 1611 Breca Ridge Dr Unit 4
- 0 W Buckeye St