Estimated Value: $104,000 - $128,000
--
Bed
--
Bath
1,018
Sq Ft
$111/Sq Ft
Est. Value
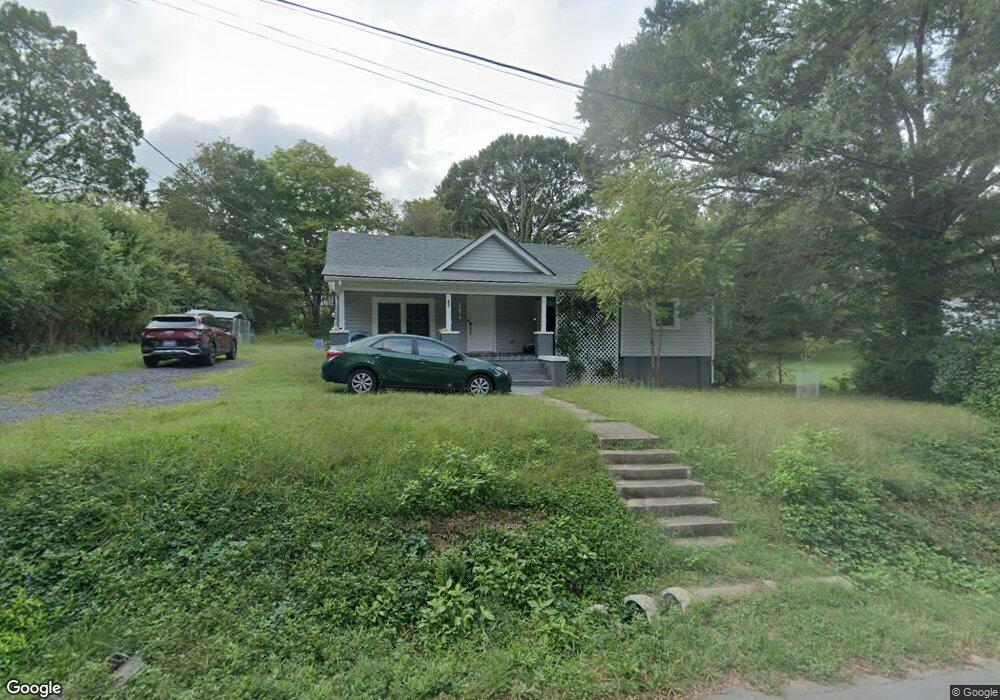
About This Home
This home is located at 203 Short Union St, Eden, NC 27288 and is currently estimated at $112,785, approximately $110 per square foot. 203 Short Union St is a home located in Rockingham County with nearby schools including Leaksville-Spray Elementary School, J.E. Holmes Middle School, and John M. Morehead High School.
Ownership History
Date
Name
Owned For
Owner Type
Purchase Details
Closed on
May 11, 2023
Sold by
Asfour Ahmad Mujahed and Asfour Meraa
Bought by
Abou-Samra Aiman
Current Estimated Value
Home Financials for this Owner
Home Financials are based on the most recent Mortgage that was taken out on this home.
Original Mortgage
$15,000
Outstanding Balance
$14,578
Interest Rate
6.32%
Estimated Equity
$98,207
Purchase Details
Closed on
Mar 9, 2021
Sold by
Pulliam Jody Lee
Bought by
Astour Ahmad Mujahed
Purchase Details
Closed on
Aug 9, 2018
Sold by
Edwards Newby Jr Thomas
Bought by
Pulliam Jody Lee
Purchase Details
Closed on
Jul 8, 2005
Sold by
Hambrick Catherine H
Bought by
Webb Daniel R and Webb June B
Create a Home Valuation Report for This Property
The Home Valuation Report is an in-depth analysis detailing your home's value as well as a comparison with similar homes in the area
Home Values in the Area
Average Home Value in this Area
Purchase History
| Date | Buyer | Sale Price | Title Company |
|---|---|---|---|
| Abou-Samra Aiman | $90,000 | None Listed On Document | |
| Abou-Samra Aiman | $90,000 | None Listed On Document | |
| Astour Ahmad Mujahed | -- | None Available | |
| Pulliam Jody Lee | -- | None Available | |
| Webb Daniel R | $45,000 | None Available |
Source: Public Records
Mortgage History
| Date | Status | Borrower | Loan Amount |
|---|---|---|---|
| Open | Abou-Samra Aiman | $15,000 | |
| Closed | Abou-Samra Aiman | $15,000 | |
| Open | Abou-Samra Aiman | $79,500 | |
| Closed | Abou-Samra Aiman | $79,500 |
Source: Public Records
Tax History Compared to Growth
Tax History
| Year | Tax Paid | Tax Assessment Tax Assessment Total Assessment is a certain percentage of the fair market value that is determined by local assessors to be the total taxable value of land and additions on the property. | Land | Improvement |
|---|---|---|---|---|
| 2025 | $632 | $95,760 | $8,560 | $87,200 |
| 2024 | $620 | $95,760 | $8,560 | $87,200 |
| 2023 | $620 | $44,924 | $7,704 | $37,220 |
| 2022 | $357 | $44,924 | $7,704 | $37,220 |
| 2021 | $357 | $44,924 | $7,704 | $37,220 |
| 2020 | $357 | $44,924 | $7,704 | $37,220 |
| 2019 | $279 | $35,042 | $7,704 | $27,338 |
| 2018 | $408 | $51,276 | $14,704 | $36,572 |
| 2017 | $408 | $51,276 | $14,704 | $36,572 |
| 2015 | $412 | $51,276 | $14,704 | $36,572 |
| 2014 | $408 | $51,276 | $14,704 | $36,572 |
Source: Public Records
Map
Nearby Homes
- 202 Short Union St
- 211 Short Union St
- 134 N Oakland Ave
- 126 N Oakland Ave
- 126 N Oakland Ave
- 130 N Oakland Ave
- 1011 4th St
- 221 Short Union St
- 1010 4th St
- 133 N Oakland Ave
- 103 Short Union St
- 1007 4th St
- 1015 Ellett Ave
- 116 Union St
- 213 Bryant St
- 227 Short Union St
- 114 Union St
- 115 Union St
- 203 Bryant St
- 1011 Ellett Ave