203 Sunset Ridge Dripping Springs, TX 78620
North Hays NeighborhoodEstimated Value: $1,101,000 - $1,631,952
--
Bed
--
Bath
3,338
Sq Ft
$409/Sq Ft
Est. Value
About This Home
This home is located at 203 Sunset Ridge, Dripping Springs, TX 78620 and is currently estimated at $1,366,476, approximately $409 per square foot. 203 Sunset Ridge is a home located in Hays County with nearby schools including Dripping Springs Middle School and Dripping Springs High School.
Ownership History
Date
Name
Owned For
Owner Type
Purchase Details
Closed on
Feb 6, 2025
Sold by
Brooks Michael D and Brooks Robyn M
Bought by
Brooks Michael D and Brooks Robyn M
Current Estimated Value
Purchase Details
Closed on
Aug 16, 1991
Sold by
Ncnb Texas National Bank
Bought by
Brooks Michael D and Brooks Robyn M
Create a Home Valuation Report for This Property
The Home Valuation Report is an in-depth analysis detailing your home's value as well as a comparison with similar homes in the area
Home Values in the Area
Average Home Value in this Area
Purchase History
| Date | Buyer | Sale Price | Title Company |
|---|---|---|---|
| Brooks Michael D | -- | None Listed On Document | |
| Brooks Michael D | -- | -- |
Source: Public Records
Tax History Compared to Growth
Tax History
| Year | Tax Paid | Tax Assessment Tax Assessment Total Assessment is a certain percentage of the fair market value that is determined by local assessors to be the total taxable value of land and additions on the property. | Land | Improvement |
|---|---|---|---|---|
| 2025 | $19,197 | $1,591,521 | $1,125,120 | $466,401 |
| 2024 | $19,197 | $1,595,952 | $1,125,120 | $470,832 |
| 2023 | $22,190 | $1,469,521 | $1,125,120 | $521,753 |
| 2022 | $10,926 | $640,574 | $139,920 | $782,470 |
| 2021 | $10,895 | $582,340 | $205,560 | $533,690 |
| 2020 | $9,548 | $529,400 | $44,320 | $485,080 |
| 2019 | $10,105 | $490,000 | $44,320 | $445,680 |
| 2018 | $10,056 | $484,950 | $44,320 | $440,630 |
| 2017 | $9,885 | $473,060 | $44,320 | $428,740 |
| 2016 | $9,684 | $463,450 | $44,320 | $419,130 |
| 2015 | $8,511 | $441,150 | $44,320 | $396,830 |
Source: Public Records
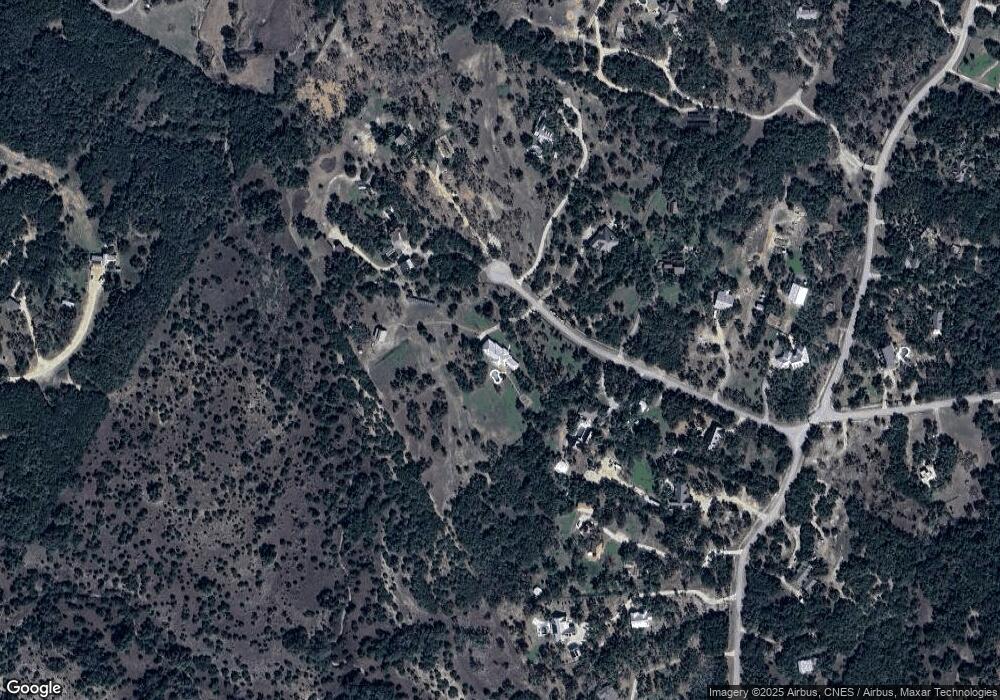
Map
Nearby Homes
- 301 Sundance Trail
- 302 High Plains Dr
- 310 Saddle Blanket Dr
- 19905 Hamilton Pool Rd
- 20001 Hamilton Pool Rd
- 806 Bell Springs Rd
- 1008 Bell Springs Rd
- 203 Stirrup Dr
- 108 Oak Ridge
- 529 Julieanne Cove
- 416 Julieanne Cove
- 210 Lakeshore Dr
- 112 Twin Saddles Ln
- 9909 Mor Dr
- 9604 Sisk Ln
- 18220 Shepherds Corral
- TBD S Oak Forest Dr
- 0000 S Oak Forest Dr
- 10215 Hill Country Skyline
- 301 Medlin Creek Loop
- 111 Sunset Ridge
- 150 Sunset Ridge
- 220 Sunset Ridge
- 110 Sunset Ridge
- 230 Sunset Ridge
- 290 Sunset Ridge
- 410 Sunrise Trail
- 104 Sunset Ridge
- 101 Sunset Ridge
- 408 Sunrise Trail
- 500 Sunrise Trail
- 100 Sunset Ridge
- Lot 72 Saddletree Ln
- 506 Sunrise Trail
- 409 Sunrise Trail
- 708 Saddletree Ln
- 225 E Lakeshore Dr
- 507 Sunrise Trail
- 0 Saddletree Ln Unit 8251846