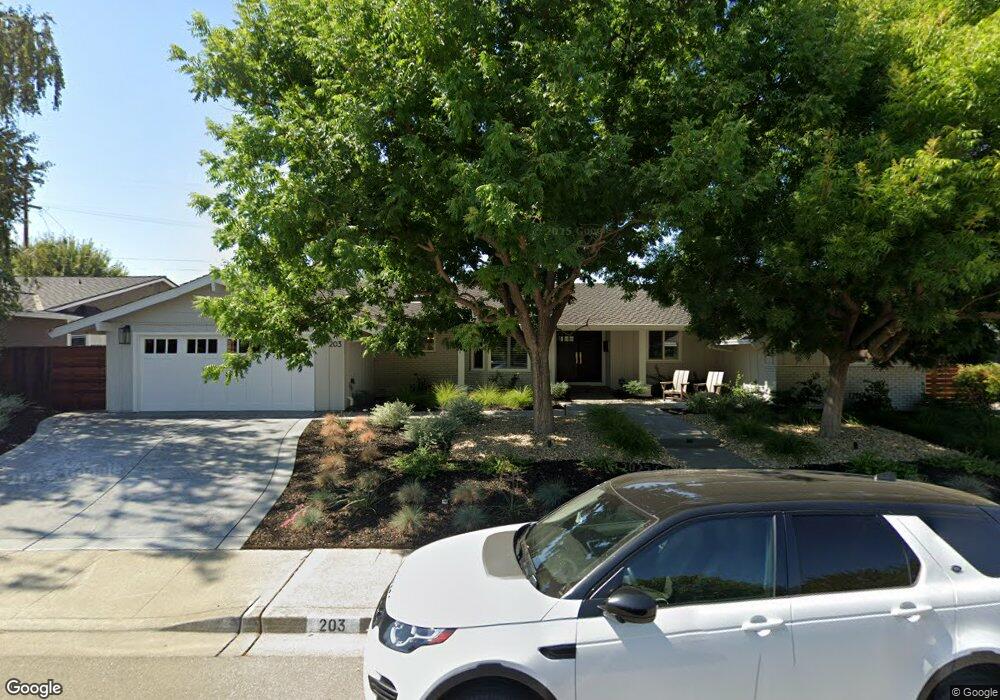
203 Via Monte Walnut Creek, CA 94598
Northgate NeighborhoodEstimated Value: $1,640,000 - $1,680,000
5
Beds
3
Baths
2,253
Sq Ft
$736/Sq Ft
Est. Value
About This Home
This home is located at 203 Via Monte, Walnut Creek, CA 94598 and is currently estimated at $1,657,683, approximately $735 per square foot. 203 Via Monte is a home located in Contra Costa County with nearby schools including Walnut Acres Elementary School, Foothill Middle School, and Northgate High School.
Ownership History
Date
Name
Owned For
Owner Type
Purchase Details
Closed on
Feb 9, 2021
Sold by
Magnell Michael and Magnell Alexandra
Bought by
Magnell Michael Lance and Magnell Alexandra Artomas
Current Estimated Value
Home Financials for this Owner
Home Financials are based on the most recent Mortgage that was taken out on this home.
Original Mortgage
$1,064,000
Outstanding Balance
$950,807
Interest Rate
2.65%
Mortgage Type
New Conventional
Estimated Equity
$706,876
Purchase Details
Closed on
Jan 3, 2020
Sold by
Crosby Pamela A
Bought by
Magnell Michael and Magnell Alexandra
Home Financials for this Owner
Home Financials are based on the most recent Mortgage that was taken out on this home.
Original Mortgage
$1,070,315
Interest Rate
4.37%
Mortgage Type
New Conventional
Purchase Details
Closed on
Apr 27, 1995
Sold by
Jacob Bette E
Bought by
Jacob Bette E and Jacob Jerry J
Purchase Details
Closed on
Sep 16, 1994
Sold by
Jacob Jerry J and Jacob Bette E
Bought by
Jacob Bette E
Create a Home Valuation Report for This Property
The Home Valuation Report is an in-depth analysis detailing your home's value as well as a comparison with similar homes in the area
Home Values in the Area
Average Home Value in this Area
Purchase History
| Date | Buyer | Sale Price | Title Company |
|---|---|---|---|
| Magnell Michael Lance | -- | Fidelity National Title Co | |
| Magnell Michael | $1,190,000 | Fidelity National Title Co | |
| Jacob Bette E | -- | -- | |
| Jacob Bette E | -- | -- |
Source: Public Records
Mortgage History
| Date | Status | Borrower | Loan Amount |
|---|---|---|---|
| Open | Magnell Michael Lance | $1,064,000 | |
| Closed | Magnell Michael | $1,070,315 |
Source: Public Records
Tax History Compared to Growth
Tax History
| Year | Tax Paid | Tax Assessment Tax Assessment Total Assessment is a certain percentage of the fair market value that is determined by local assessors to be the total taxable value of land and additions on the property. | Land | Improvement |
|---|---|---|---|---|
| 2025 | $14,901 | $1,301,434 | $929,598 | $371,836 |
| 2024 | $14,668 | $1,275,917 | $911,371 | $364,546 |
| 2023 | $14,668 | $1,250,900 | $893,501 | $357,399 |
| 2022 | $14,541 | $1,226,374 | $875,982 | $350,392 |
| 2021 | $14,225 | $1,202,328 | $858,806 | $343,522 |
| 2020 | $2,310 | $140,450 | $43,101 | $97,349 |
| 2019 | $2,291 | $137,697 | $42,256 | $95,441 |
| 2018 | $2,204 | $134,998 | $41,428 | $93,570 |
| 2017 | $2,122 | $132,352 | $40,616 | $91,736 |
| 2016 | $2,053 | $129,758 | $39,820 | $89,938 |
| 2015 | $2,016 | $127,810 | $39,222 | $88,588 |
| 2014 | $1,970 | $125,307 | $38,454 | $86,853 |
Source: Public Records
Map
Nearby Homes
- 3067 Stinson Cir
- 206 Hamlin Loop
- 401 Seville Ln
- 3318 Ellesmere Ct
- 817 Cheyenne Dr
- 2890 Treat Blvd Unit 5
- 1053 Arkell Rd
- 3051 Treat Blvd Unit 129
- 2830 Royal Ann Ln
- 3055 Treat Blvd Unit 36
- 2840 Royal Ann Ln
- 1032 Millbrook Ct
- 1031 Millbrook Ct
- 825 Oak Grove Rd Unit 46
- 567 Cabot Ct
- 1936 Nero Ct
- 1960 Pomar Way
- 3171 Lippizaner Ln
- 165 Pine Creek Rd
- 788 Woodwind Place
- 161 Via Monte
- 213 Via Monte
- 162 Venado Corte
- 172 Venado Corte
- 152 Venado Corte
- 2805 Encina Camino
- 151 Via Monte
- 225 Via Monte
- 216 Via Monte
- 182 Venado Corte
- 2808 Encina Camino
- 142 Venado Corte
- 226 Via Monte
- 159 Venado Corte
- 2817 Encina Camino
- 169 Venado Corte
- 141 Via Monte
- 237 Via Monte
- 192 Venado Corte
- 219 Paloma Corte