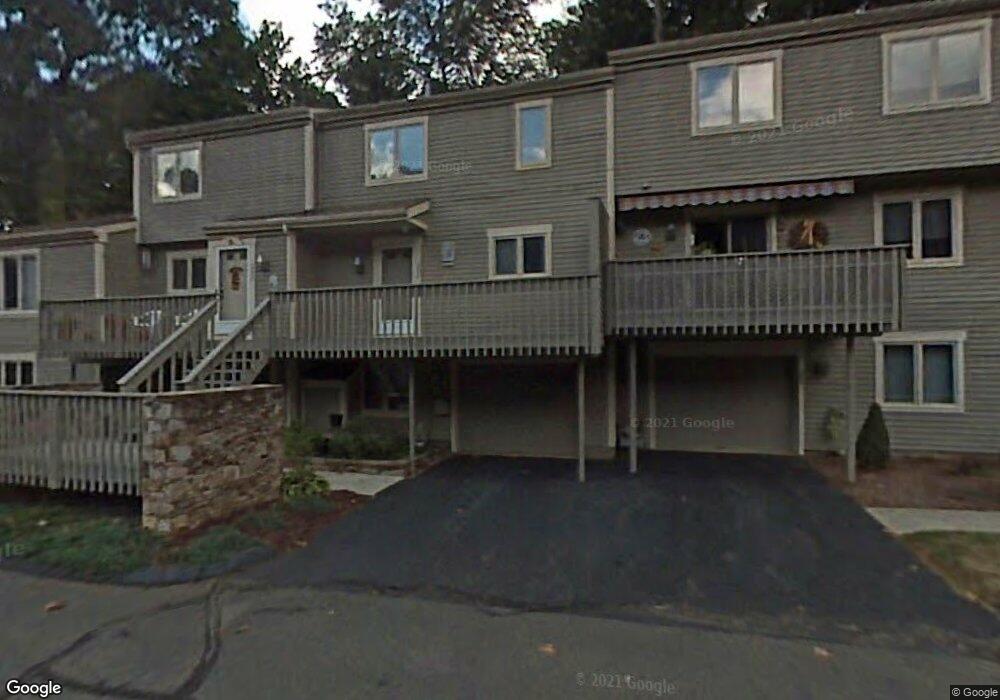
203 Waters Edge Dr Southington, CT 06489
East Southington NeighborhoodEstimated Value: $263,000 - $343,000
2
Beds
3
Baths
1,452
Sq Ft
$205/Sq Ft
Est. Value
About This Home
This home is located at 203 Waters Edge Dr, Southington, CT 06489 and is currently estimated at $297,807, approximately $205 per square foot. 203 Waters Edge Dr is a home located in Hartford County with nearby schools including Hatton Elementary School, Joseph A. Depaolo Middle School, and Southington High School.
Ownership History
Date
Name
Owned For
Owner Type
Purchase Details
Closed on
Jun 16, 2015
Sold by
Hickman Robert W and Hickman Georgiane M
Bought by
Gadomski Wojciech
Current Estimated Value
Purchase Details
Closed on
Apr 22, 2015
Sold by
Bernklau Jane M
Bought by
Hickman Robert W and Hickman Georgiane M
Purchase Details
Closed on
Jun 2, 2008
Sold by
Hoberman Barry J and Hoberman Diane F
Bought by
Bernkiau Marvin R and Bernklau Jane M
Home Financials for this Owner
Home Financials are based on the most recent Mortgage that was taken out on this home.
Original Mortgage
$196,000
Interest Rate
5.91%
Purchase Details
Closed on
Sep 19, 2002
Sold by
Beliveau Miriam D
Bought by
Hoberman Diane F and Hoberman Barry J
Home Financials for this Owner
Home Financials are based on the most recent Mortgage that was taken out on this home.
Original Mortgage
$75,000
Interest Rate
5.38%
Create a Home Valuation Report for This Property
The Home Valuation Report is an in-depth analysis detailing your home's value as well as a comparison with similar homes in the area
Home Values in the Area
Average Home Value in this Area
Purchase History
| Date | Buyer | Sale Price | Title Company |
|---|---|---|---|
| Gadomski Wojciech | $125,000 | -- | |
| Hickman Robert W | $138,000 | -- | |
| Bernkiau Marvin R | $201,000 | -- | |
| Hoberman Diane F | $169,000 | -- |
Source: Public Records
Mortgage History
| Date | Status | Borrower | Loan Amount |
|---|---|---|---|
| Previous Owner | Hoberman Diane F | $195,557 | |
| Previous Owner | Hoberman Diane F | $201,700 | |
| Previous Owner | Hoberman Diane F | $196,000 | |
| Previous Owner | Hoberman Diane F | $75,000 |
Source: Public Records
Tax History Compared to Growth
Tax History
| Year | Tax Paid | Tax Assessment Tax Assessment Total Assessment is a certain percentage of the fair market value that is determined by local assessors to be the total taxable value of land and additions on the property. | Land | Improvement |
|---|---|---|---|---|
| 2025 | $4,179 | $125,850 | $0 | $125,850 |
| 2024 | $3,957 | $125,850 | $0 | $125,850 |
| 2023 | $3,821 | $125,850 | $0 | $125,850 |
| 2022 | $3,666 | $125,850 | $0 | $125,850 |
| 2021 | $3,653 | $125,850 | $0 | $125,850 |
| 2020 | $3,415 | $111,500 | $0 | $111,500 |
| 2019 | $3,416 | $111,500 | $0 | $111,500 |
| 2018 | $3,399 | $111,500 | $0 | $111,500 |
| 2017 | $3,399 | $111,500 | $0 | $111,500 |
| 2016 | $3,305 | $111,500 | $0 | $111,500 |
| 2015 | $3,458 | $118,670 | $0 | $118,670 |
| 2014 | -- | $118,670 | $0 | $118,670 |
Source: Public Records
Map
Nearby Homes
- 543 S Farms Terrace Unit 543
- 492 Carriage Dr Unit 492
- 18 Coach Dr
- 9 Village Rd
- 8 Village Rd Unit 8
- 1 Coach Dr Unit 1
- 1 Putting Green Path
- 332 Songbird Ln Unit 332
- 4 Hickory Hill Rd
- 256 Berlin St
- 46 Skyline Dr
- 26 Cedar Dr
- 100 Berlin St
- 30 Prosperity Ct Unit 8
- 152 Sun Valley Dr
- 1477 East St
- 179 Sun Valley Dr
- 131 Michael Dr
- 108 Hobart St
- 199 Darling St
- 203 Waters Edge Dr Unit 203
- 202 Waters Edge Dr
- 202 Waters Edge Dr Unit 202
- 201 Waters Edge Dr
- 233 Snow Owl Dr
- 211 Waters Edge Dr
- 234 Snow Owl Dr
- 235 Snow Owl Dr
- 235 Snow Owl Dr Unit 235
- 241 Snow Owl Dr
- 212 Waters Edge Dr
- 232 Snow Owl Dr
- 242 Snow Owl Dr
- 194 Waters Edge Dr
- 194 Waters Edge Dr Unit 194
- 231 Snow Owl Dr
- 213 Waters Edge Dr
- 213 Waters Edge Dr Unit 213
- 243 Snow Owl Dr
- 193 Waters Edge Dr