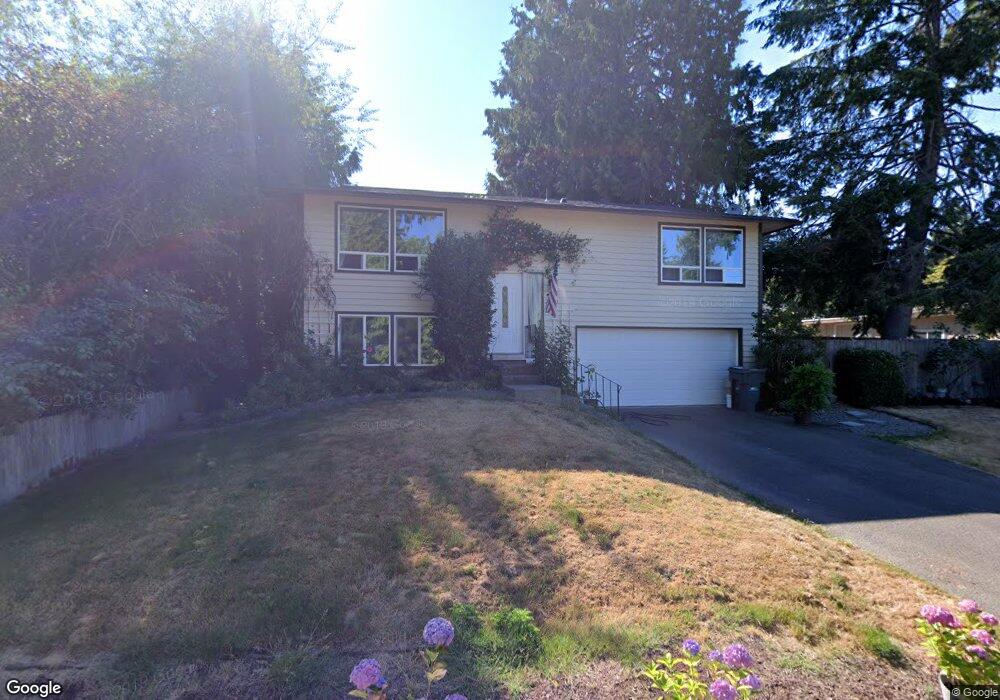
2030 Bayview Ave E Port Orchard, WA 98366
Manchester NeighborhoodEstimated Value: $428,000 - $479,000
3
Beds
2
Baths
960
Sq Ft
$476/Sq Ft
Est. Value
About This Home
This home is located at 2030 Bayview Ave E, Port Orchard, WA 98366 and is currently estimated at $457,072, approximately $476 per square foot. 2030 Bayview Ave E is a home located in Kitsap County with nearby schools including Manchester Elementary School, John Sedgwick Middle School, and South Kitsap High School.
Ownership History
Date
Name
Owned For
Owner Type
Purchase Details
Closed on
Aug 6, 2009
Sold by
Hardison Patricia
Bought by
Hardison Patricia
Current Estimated Value
Purchase Details
Closed on
Jul 14, 1999
Sold by
Ft Mtg Companies
Bought by
Hardison Melvin E and Hardison Patricia
Home Financials for this Owner
Home Financials are based on the most recent Mortgage that was taken out on this home.
Original Mortgage
$90,450
Outstanding Balance
$25,016
Interest Rate
7.4%
Estimated Equity
$432,056
Purchase Details
Closed on
Jan 13, 1999
Sold by
Carman Jamie R and Carman Agnes V
Bought by
Federal National Mortgage Association
Purchase Details
Closed on
Aug 12, 1996
Sold by
Newell Robert L and Newell Claudia A
Bought by
Carman Jamie R and Carman Agnes
Home Financials for this Owner
Home Financials are based on the most recent Mortgage that was taken out on this home.
Original Mortgage
$113,950
Interest Rate
8.18%
Mortgage Type
VA
Create a Home Valuation Report for This Property
The Home Valuation Report is an in-depth analysis detailing your home's value as well as a comparison with similar homes in the area
Home Values in the Area
Average Home Value in this Area
Purchase History
| Date | Buyer | Sale Price | Title Company |
|---|---|---|---|
| Hardison Patricia | -- | None Available | |
| Hardison Melvin E | $100,500 | Pacific Nw Title | |
| Federal National Mortgage Association | $112,500 | Transnation Title Ins Co | |
| Carman Jamie R | $113,950 | -- |
Source: Public Records
Mortgage History
| Date | Status | Borrower | Loan Amount |
|---|---|---|---|
| Open | Hardison Melvin E | $90,450 | |
| Previous Owner | Carman Jamie R | $113,950 |
Source: Public Records
Tax History Compared to Growth
Tax History
| Year | Tax Paid | Tax Assessment Tax Assessment Total Assessment is a certain percentage of the fair market value that is determined by local assessors to be the total taxable value of land and additions on the property. | Land | Improvement |
|---|---|---|---|---|
| 2026 | $3,207 | $365,760 | $88,810 | $276,950 |
| 2025 | $3,207 | $365,760 | $88,810 | $276,950 |
| 2024 | $3,110 | $365,760 | $88,810 | $276,950 |
| 2023 | $3,087 | $365,760 | $88,810 | $276,950 |
| 2022 | $2,958 | $293,300 | $70,920 | $222,380 |
| 2021 | $2,726 | $255,400 | $61,670 | $193,730 |
| 2020 | $2,556 | $232,420 | $57,860 | $174,560 |
| 2019 | $2,203 | $219,930 | $54,690 | $165,240 |
| 2018 | $2,305 | $172,880 | $47,460 | $125,420 |
| 2017 | $1,910 | $172,880 | $47,460 | $125,420 |
| 2016 | $1,882 | $156,040 | $45,200 | $110,840 |
| 2015 | $1,825 | $153,460 | $45,200 | $108,260 |
| 2014 | -- | $137,950 | $45,810 | $92,140 |
| 2013 | -- | $137,950 | $45,810 | $92,140 |
Source: Public Records
Map
Nearby Homes
- 7748 E Hemlock St
- 7549 E Alki View Ct
- 7230 E Maple St
- 2372 Valley Ave E
- 2440 Alaska Ave E
- 7548 E Grandview St
- 1738 Lilypad Place E
- 2585 Alaska Ave E
- 6418 E Royalview Ln
- 8079 E Main St Unit 341
- 1630 & 1632 Colchester Dr E
- 8009 E Commons Ct
- 7260 E Last Refuge Way
- 7590 E Idaho St
- 7000 E Dakota St
- 1083 Puget Dr E
- 7579 E Idaho St
- 7041 E Washington St
- 7569 E Montana St
- 8471 E Caraway Rd
- 2022 Bayview Ave E
- 2032 Bayview Ave E
- 2039 Cedar St E
- 2047 Cedar St E
- 2025 Cedar St E
- 2061 Cedar St E
- 2056 Alaska Ave E
- 7535 E Juneau Ct
- 2046 Bayview Ave E
- 7540 E Juneau Ct
- 7450 E Madrone Ave
- 7481 E Sitka Ct
- 7489 E Sitka Ct
- 7574 E Madrone Ave
- 2030 Cedar St E
- 2040 Cedar St E
- 7545 E Juneau Ct
- 2024 Cedar St E
- 2060 Cedar St E
- 2072 Alaska Ave E