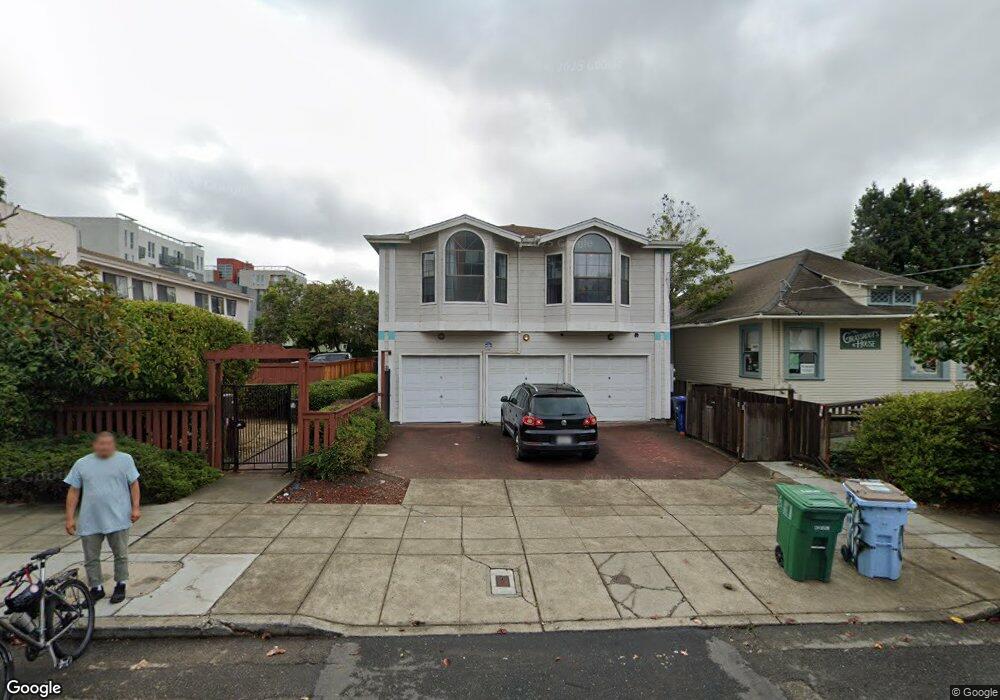
2030 Blake St Unit A Berkeley, CA 94704
South Berkeley NeighborhoodEstimated Value: $769,000 - $901,000
3
Beds
2
Baths
1,225
Sq Ft
$693/Sq Ft
Est. Value
About This Home
This home is located at 2030 Blake St Unit A, Berkeley, CA 94704 and is currently estimated at $849,232, approximately $693 per square foot. 2030 Blake St Unit A is a home located in Alameda County with nearby schools including Malcolm X Elementary School, Emerson Elementary School, and John Muir Elementary School.
Ownership History
Date
Name
Owned For
Owner Type
Purchase Details
Closed on
Jan 12, 2006
Sold by
Ha Yong Chool
Bought by
Ha Yang Won K
Current Estimated Value
Home Financials for this Owner
Home Financials are based on the most recent Mortgage that was taken out on this home.
Original Mortgage
$400,000
Outstanding Balance
$216,092
Interest Rate
5.62%
Mortgage Type
Purchase Money Mortgage
Estimated Equity
$633,140
Purchase Details
Closed on
Jan 9, 2006
Sold by
Clippinger Terence M and Clippinger Dainese A
Bought by
Ha Yang Won K
Home Financials for this Owner
Home Financials are based on the most recent Mortgage that was taken out on this home.
Original Mortgage
$400,000
Outstanding Balance
$216,092
Interest Rate
5.62%
Mortgage Type
Purchase Money Mortgage
Estimated Equity
$633,140
Purchase Details
Closed on
Feb 4, 2002
Sold by
Clippinger Terence M and Clippinger Dainese A
Bought by
Clippinger Terence M and Clippinger Dainese A
Purchase Details
Closed on
May 19, 1998
Sold by
Banta Dante A and Banta Zenaida P
Bought by
Clippinger Terence M and Clippinger Dainese A
Home Financials for this Owner
Home Financials are based on the most recent Mortgage that was taken out on this home.
Original Mortgage
$169,600
Interest Rate
7.07%
Create a Home Valuation Report for This Property
The Home Valuation Report is an in-depth analysis detailing your home's value as well as a comparison with similar homes in the area
Home Values in the Area
Average Home Value in this Area
Purchase History
| Date | Buyer | Sale Price | Title Company |
|---|---|---|---|
| Ha Yang Won K | -- | Chicago Title Co | |
| Ha Yang Won K | $500,000 | Chicago Title Company | |
| Clippinger Terence M | -- | -- | |
| Clippinger Terence M | $212,000 | Placer Title Company |
Source: Public Records
Mortgage History
| Date | Status | Borrower | Loan Amount |
|---|---|---|---|
| Open | Ha Yang Won K | $400,000 | |
| Previous Owner | Clippinger Terence M | $169,600 |
Source: Public Records
Tax History Compared to Growth
Tax History
| Year | Tax Paid | Tax Assessment Tax Assessment Total Assessment is a certain percentage of the fair market value that is determined by local assessors to be the total taxable value of land and additions on the property. | Land | Improvement |
|---|---|---|---|---|
| 2025 | $10,701 | $683,230 | $204,969 | $478,261 |
| 2024 | $10,701 | $669,834 | $200,950 | $468,884 |
| 2023 | $10,474 | $656,704 | $197,011 | $459,693 |
| 2022 | $10,288 | $643,830 | $193,149 | $450,681 |
| 2021 | $10,307 | $631,210 | $189,363 | $441,847 |
| 2020 | $9,771 | $624,740 | $187,422 | $437,318 |
| 2019 | $9,406 | $612,494 | $183,748 | $428,746 |
| 2018 | $9,255 | $600,490 | $180,147 | $420,343 |
| 2017 | $8,933 | $588,720 | $176,616 | $412,104 |
| 2016 | $8,654 | $577,180 | $173,154 | $404,026 |
| 2015 | $8,317 | $568,514 | $170,554 | $397,960 |
| 2014 | $8,262 | $557,380 | $167,214 | $390,166 |
Source: Public Records
Map
Nearby Homes
- 1901 Parker St Unit 3
- 1819 Carleton St
- 2533 Grant St
- 2537 Ellsworth St
- 2308 Parker St
- 2701 Grant St
- 2316 Blake St Unit D
- 2918 Newbury St
- 1718 Bancroft Way
- 1626 Dwight Way
- 1612 Parker St
- 2110 Ashby Ave
- 1612 Carleton St
- 1604 Dwight Way
- 2411 Durant Ave
- 2057 Emerson St
- 1606 Derby St
- 2419 Durant Ave
- 2709 California St
- 2218 -2222 Grant St
- 2030 Blake St Unit D
- 2030 Blake St Unit B
- 2030 Blake St Unit C
- 2022 Blake St
- 2020 Blake St
- 2018 Blake St
- 2031 Parker St
- 2027 Parker St
- 2023 Parker St
- 2035 Parker St
- 2019 Parker St
- 2019 -2021 Parker St
- 2033 Blake St
- 2017 Parker St
- 2033-2035 Blake St
- 2033-2035 Blake St
- 2015 Parker St
- 2035 Blake St
- 2578 Shattuck Ave
- 2011 Parker St