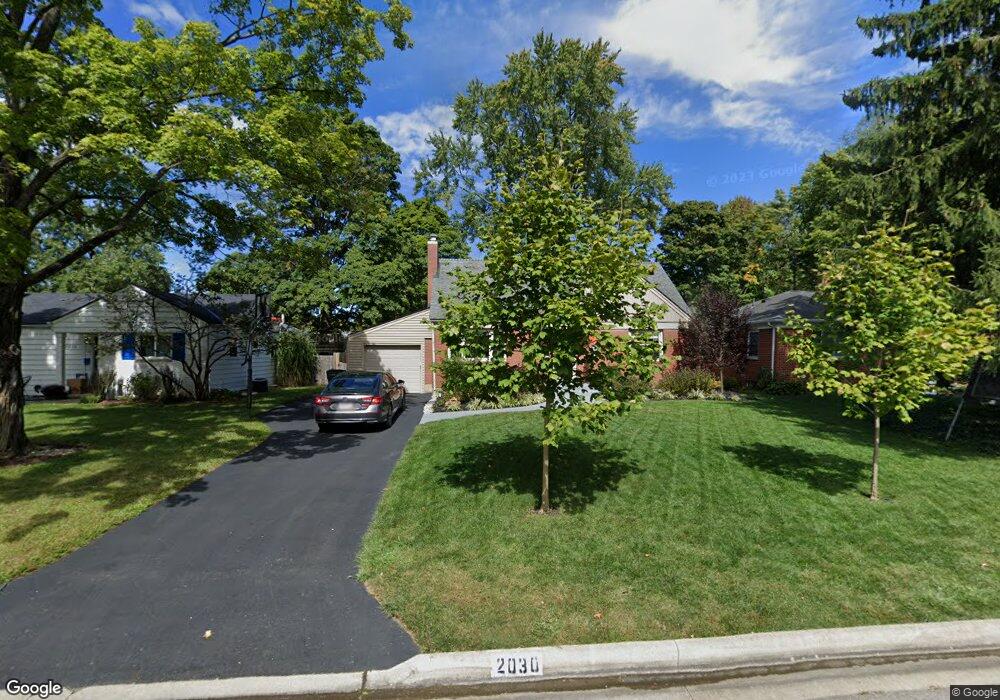
2030 Kentwell Rd Columbus, OH 43221
Estimated Value: $516,280 - $553,000
3
Beds
2
Baths
2,000
Sq Ft
$269/Sq Ft
Est. Value
About This Home
This home is located at 2030 Kentwell Rd, Columbus, OH 43221 and is currently estimated at $537,070, approximately $268 per square foot. 2030 Kentwell Rd is a home located in Franklin County with nearby schools including Tremont Elementary School, Jones Middle School, and Upper Arlington High School.
Ownership History
Date
Name
Owned For
Owner Type
Purchase Details
Closed on
Oct 21, 2011
Sold by
Thompson Andrew D
Bought by
Keyes Tiffany I
Current Estimated Value
Home Financials for this Owner
Home Financials are based on the most recent Mortgage that was taken out on this home.
Original Mortgage
$239,850
Outstanding Balance
$163,745
Interest Rate
4.12%
Mortgage Type
Purchase Money Mortgage
Estimated Equity
$373,325
Purchase Details
Closed on
Mar 20, 2007
Sold by
Mcbrayer Michael S
Bought by
Thompson Andrew D
Home Financials for this Owner
Home Financials are based on the most recent Mortgage that was taken out on this home.
Original Mortgage
$260,000
Interest Rate
6.27%
Mortgage Type
Purchase Money Mortgage
Purchase Details
Closed on
Aug 14, 1998
Sold by
Baumgartner Robert S and Baumgartner Barbara J
Bought by
Mcbrayer Michael S and Smith Stephanie A
Create a Home Valuation Report for This Property
The Home Valuation Report is an in-depth analysis detailing your home's value as well as a comparison with similar homes in the area
Home Values in the Area
Average Home Value in this Area
Purchase History
| Date | Buyer | Sale Price | Title Company |
|---|---|---|---|
| Keyes Tiffany I | $252,500 | Mepfidelity N | |
| Thompson Andrew D | $260,000 | Hummel | |
| Mcbrayer Michael S | $132,000 | Franklin Abstract |
Source: Public Records
Mortgage History
| Date | Status | Borrower | Loan Amount |
|---|---|---|---|
| Open | Keyes Tiffany I | $239,850 | |
| Previous Owner | Thompson Andrew D | $260,000 |
Source: Public Records
Tax History Compared to Growth
Tax History
| Year | Tax Paid | Tax Assessment Tax Assessment Total Assessment is a certain percentage of the fair market value that is determined by local assessors to be the total taxable value of land and additions on the property. | Land | Improvement |
|---|---|---|---|---|
| 2024 | $7,959 | $137,410 | $52,920 | $84,490 |
| 2023 | $7,892 | $137,410 | $52,920 | $84,490 |
| 2022 | $8,553 | $122,400 | $34,020 | $88,380 |
| 2021 | $7,571 | $122,400 | $34,020 | $88,380 |
| 2020 | $7,504 | $122,400 | $34,020 | $88,380 |
| 2019 | $6,961 | $100,380 | $34,020 | $66,360 |
| 2018 | $6,235 | $100,380 | $34,020 | $66,360 |
| 2017 | $6,218 | $100,380 | $34,020 | $66,360 |
| 2016 | $5,529 | $83,620 | $24,680 | $58,940 |
| 2015 | $5,524 | $83,620 | $24,680 | $58,940 |
| 2014 | $5,530 | $83,620 | $24,680 | $58,940 |
| 2013 | $2,641 | $76,020 | $22,435 | $53,585 |
Source: Public Records
Map
Nearby Homes
- 1887-1891 Kentwell Rd
- 3296 Leighton Rd
- 1909 Inchcliff Rd
- 2227 Zollinger Rd
- 3175 Tremont Rd Unit 502
- 1764 Ridgecliff Rd Unit 1764
- 2162 Oakmount Rd
- 3041 Avalon Rd
- 3015 Welsford Rd
- 2370 Zollinger Rd
- 2979 Avalon Rd
- 1767 Riverhill Rd
- 3509 Redding Rd
- 2081 Fishinger Rd
- 2308 Shrewsbury Rd
- 2195 Edgevale Rd
- 3600 Reed Rd Unit 15
- 3444 Sunningdale Way
- 2544 Zollinger Rd
- 2401 Shrewsbury Rd
- 2022 Kentwell Rd
- 2038 Kentwell Rd
- 2046 Kentwell Rd
- 2014 Kentwell Rd
- 2023 Langham Rd
- 2031 Langham Rd
- 2015 Langham Rd
- 2054 Kentwell Rd
- 2039 Langham Rd
- 2007 Langham Rd
- 2031 Kentwell Rd
- 2039 Kentwell Rd
- 2047 Kentwell Rd
- 2015 Kentwell Rd
- 2047 Langham Rd
- 1999 Langham Rd
- 2062 Kentwell Rd
- 2000 Kentwell Rd
- 2055 Kentwell Rd
- 2007 Kentwell Rd